By Scott Irwin and Todd Hubbs
Department of Agricultural and Consumer Economics
University of Illinois
USDA’s release of the March Prospective Planting report indicated an increase in planted acreage for corn in 2019. At 92.8 million acres, the report shows approximately 3.7 million additional acres of corn planted to be planted compared to last year. Given the large acreage, corn planting progress in 2019 will once again merit considerable interest. This is compounded by cold and wet conditions over large areas of the Corn Belt that have delayed early planting. The potential for more significant planting delays or acreage adjustments depends on the rate that corn planting can proceed once the weather improves.
Conventional wisdom suggests that the U.S. corn crop can be planted in a relatively small number of days, perhaps as few as five suitable field days. This thinking is spurred on by the large size of modern planters that can obviously plant many more acres than the smaller planters of the past. However, our analysis last year (farmdoc daily, April 19, 2018) showed that the conventional wisdom is not borne out by historical data on planting progress for three states in the heart of the U.S. Corn Belt—Illinois, Indiana, and Iowa. We found a striking stability and similarity in the minimum number of days required to plant the corn crop in the three states over 1980-2017. While there is some variation in these estimates over time, on average, producers in Illinois, Indiana, and Iowa need about 14 suitable field days, or two weeks, to plant the corn crop based on maximum daily rates of planting progress, and this has changed little since 1980. Essentially, fewer bigger planters today plant about the same rate in aggregate as more smaller planters did in the past.
We can now add 2018 to our previous sample. This is especially helpful because 2018 serves as an ideal case study for the potential pace of planting the U.S. corn crop. Given the cold and/or wet conditions experienced by nearly all of the Corn Belt last April, the 2018 planting season got off to a very slow start. The USDA’s weekly Crop Progress report indicated that only 5 percent of the corn acreage in 18 major producing states was planted as of April 22, 2018, compared to a five-year average of 14 percent. Notably, 8 of the 18 states in the April 22 report had zero planting progress. The very late start to planting the 2018 corn crop meant that producers had a large incentive to plant faster if that was possible. Some have argued that investment in planting equipment during the last decade created extra capacity that simply had not been fully utilized. If this was the case, it should have been apparent in the 2018 data on planting progress. The purpose of today’s article is to update our previous estimate of the minimum number of suitable field days required to plant the U.S. corn crop and determine whether the pace of planting in 2018 was much faster than in earlier years.
Analysis
We follow the same procedures as in our earlier analysis (farmdoc daily, April 19, 2018) and examine planting progress data reported in the USDA’s weekly Crop Progress report for Illinois, Indiana, and Iowa over 1980 through 2018. The sample is extended by one year (2018) compared to our previous work. These three states contained 33 percent of the corn acreage planted in the U.S. during 2018 and are assumed to be representative of planting rates throughout the Corn Belt. We start by computing the number of acres planted per suitable field day each week that progress data is reported for each state. It is important to measure planting progress per suitable field day since this standardizes for the varying number of days during a week that are suitable for planting. Some weeks may have large reported planting progress but this could be due to an unusually high number of suitable field days rather than a high rate of planting progress per day. Since planting progress is reported as the percentage of total acreage planted, we multiply the percentage progress by total planted acreage of corn for each state in a given year to obtain planting progress in terms of acres. Note that 1994 is excluded for Indiana as we were not able to collect complete data on suitable field days that year. We recognize that the estimates of weekly planting progress and the number of days suitable for field work reflect some judgment on the part of reporters and therefore may not always be completely accurate. However, consistent reporting procedures over time should provide useful information for analysis.
Since we are interested in the minimum number of days that it is possible to plant the U.S. corn crop, we focus on weeks with the highest acreage planted per suitable field day. In other words, we want to know how fast the corn crop can be planted based on the highest rates of planting progress in the historical record. This should be kept in mind when considering the results of the analysis. Whether producers can actually maintain peak week progress for an extended period is uncertain. In addition, we average the progress per suitable field day for the two highest weeks each year in order to smooth out some outliers that appear in the single highest week each year.
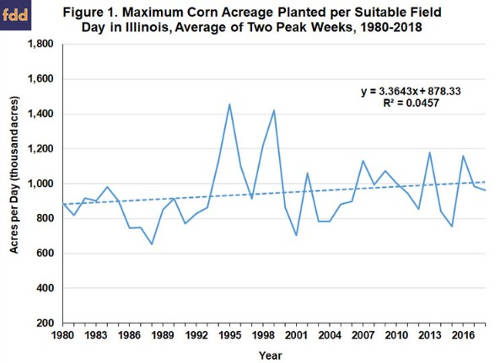
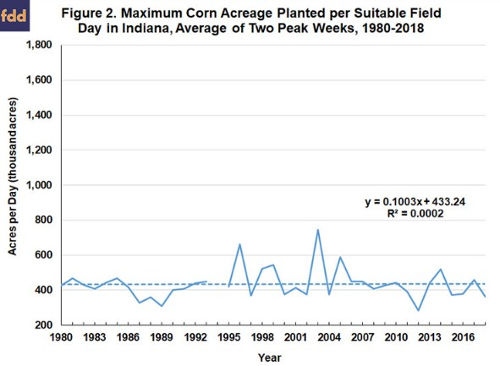
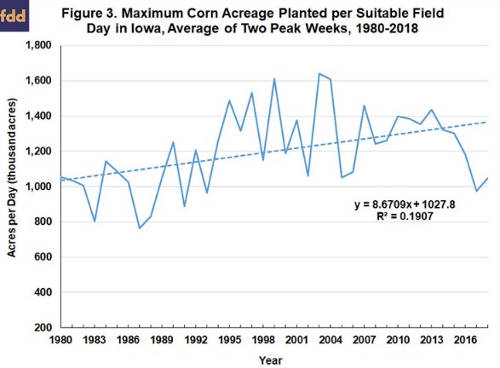
Figures 1-3 present our estimates of the maximum corn acreage planted per suitable field day in Illinois, Indiana, and Iowa, respectively, over 1980-2018. We had previously reported (farmdoc daily, April 19, 2018) a pronounced lack of an upward trend in the maximums for Illinois and Indiana, with a slight upward trend for Illinois over the sample period, from about 900 thousand acres per day in the early 1980s to about 1 million acres per day in recent years. The maximum rate per day in Indiana showed virtually no trend since 1980, averaging a bit over 400 thousand acres. The maximum rate of planting progress in Iowa exhibited a different pattern than the other two states. A pronounced upward trend was evident from 1980-2004, with the maximum rate increasing from around 1 million acres per day to around 1.6 million acres per day, an increase of 60 percent. After 2004, the maximum rate for Iowa leveled off and then dropped precipitously. Despite the obvious incentives to maximize the pace of planting in 2018 due to poor conditions during most of April, the maximum rates per suitable field day in 2018 in each of the three states were very similar to 2017 and well within the ranges experienced in recent years. In sum, the estimates in Figures 1-3 show that maximum planting rates per suitable field day in the heart of the Corn Belt have increased very little over time and were not out of the ordinary in 2018. This also indicates that investment in planting equipment during the last decade did not create extra capacity that could be called upon when conditions delayed planting substantially.
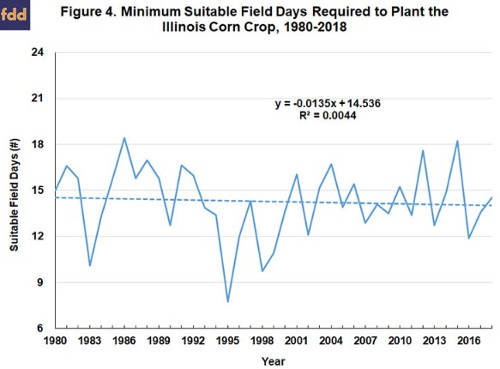
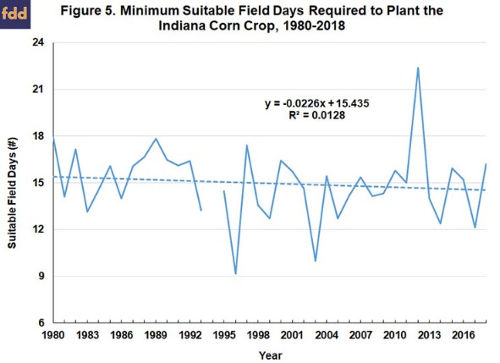
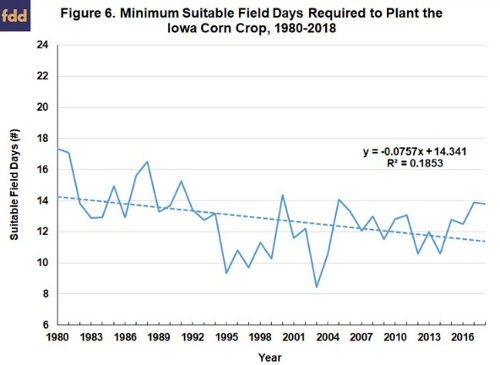
The next step of the analysis is to update our previous estimates of the minimum number of days required to plant the corn crop in each of the three states. We do this by dividing total planted acreage of corn in each state each year by the estimated maximum rate of corn planting progress per suitable field day shown in Figures 1-3. This provides an estimate of how fast the corn crop in the three states could be planted assuming the rate of daily planting is at the maximum. The computation also takes into account the changing total planted acreage of corn in each state over time. Figures 4-6 present the estimated minimums for Illinois, Indiana, and Iowa, respectively, over 1980-2018. One is immediately struck by the stability and similarity of the minimum number of days required to plant the corn crop. There is a slight downtrend in the minimum number of days for Illinois and Indiana, from about 15 days in the early 1980s to about 14 days in recent years. Mirroring the earlier results, the pattern for Iowa is different, with a notable decline through 2004 and a return in recent years to a similar number of days, about 14, as in the early 1980s. The results indicate that it takes about 14 days, or two weeks, to plant the corn crop in each of the three states assuming maximum daily rates of planting progress and this conclusion is not altered by the addition of observations for 2018.
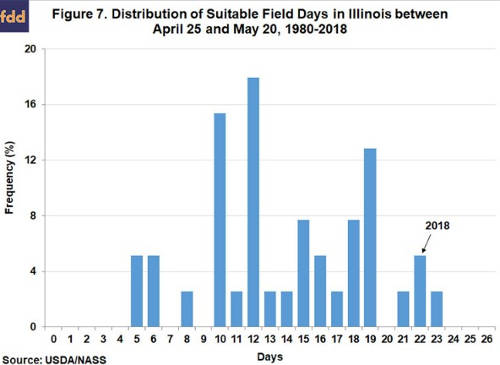
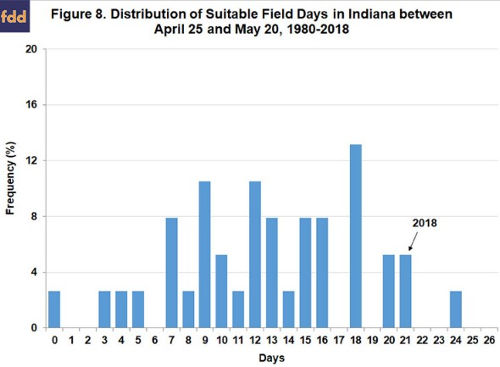
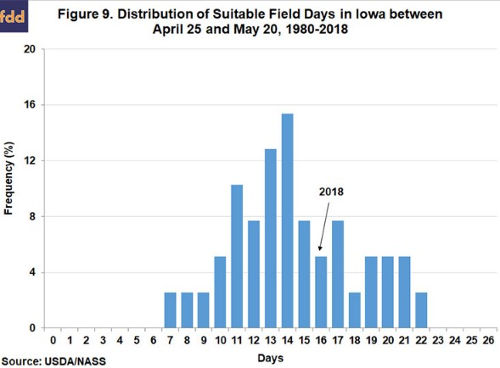
It turns out that the 2018 corn crop was planted in a timely fashion despite the late start and the fact that the maximum rate per suitable field day was not especially fast. For the U.S. as a whole, 19 percent of the corn crop in 2018 was planted after May 20, our selected cutoff date for defining late planting, and this was only slightly higher than the historical average of 18 percent. Figures 7-9 demonstrate that late planting came in near the average in 2018 due to the exceptional planting window that opened up between April 25 and May 20 in many Corn Belt states. For example, 22 out of the 26 days in 2018 for this period in Illinois were classified as suitable field days, compared to an average of 14 days. The historical distribution indicates the chance of having this many or more suitable field days is only 8 percent, or approximately a 1 out 10 event. The situation was similar for Indiana, but Iowa had a lower number of field days and this was reflected in a bit more late planted corn in that state. Regardless, there was at least 14 suitable field days between April 25 and May 20 in all three states, and consistent with our findings on the minimum number of days needed to plant the crop, this was sufficient to plant the 2018 U.S. corn crop in a timely manner.
Implications
Conventional wisdom suggests that the U.S. corn crop can be planted in just a few days, perhaps as few as five suitable field days. This thinking is spurred on by the large size of modern planters that can obviously plant many more acres than the smaller planters of the past. We update our previous analysis (farmdoc daily, April 19, 2018) of this issue by including data from 2018, which is important because 2018 serves as an ideal case study for the potential pace of planting the U.S. corn crop given the very slow start to that planting season. Once again, the conventional wisdom is not borne out by historical data on planting progress for three states in the heart of the U.S. Corn Belt—Illinois, Indiana, and Iowa. We show that maximum planting rates per suitable field day in the heart of the Corn Belt have increased very little over time and were not out of the ordinary in 2018. It turns out that the 2018 corn crop was planted in a timely fashion despite the late start and the fact that the maximum rate per suitable field day was not especially fast. The reason for the timely planting is the exceptional window that opened up between April 25 and May 20, 2018 in many Corn Belt states. For example, 22 out of the 26 days in 2018 for this period in Illinois were classified as suitable field days, approximately a 1 out 10 event. This demonstrates that weather is the key determinant of timely planting of aggregate corn acreage in the U.S. not planting rate per day, which is surprisingly stable through time. The implications of these findings for timely planting of the 2019 U.S. corn crop will be examined in a farmdoc daily article next week.
Source: farmdocdaily