By Eric Richer
Throughout this winter meeting season, fertilizer has been a hot topic. Generally, the discussion has been around nitrogen price and availability. Most of us have little to no influence on price or availability, but as a farmer, you decide your corn (and wheat) nitrogen rates, assuming you can get the nitrogen product you want. Your corn nitrogen rate could likely cost $100 per acre more in 2022 as compared to the year prior and nitrogen will probably surpass seed as the most expensive variable cost per acre this year. As such, it is important to note that the most recent revision (2020) of the Tri-State Fertilizer Recommendations for Corn, Soybean, Wheat and Alfalfa moved from nitrogen rate recommendations based on yield--from the original ‘Tri-States’--to a nitrogen rate based on maximum profitability or a maximum return to nitrogen (MRTN) rate. Sometimes the maximum return to nitrogen rate is referred to as the Economic Optimum Nitrogen Rate (EONR).
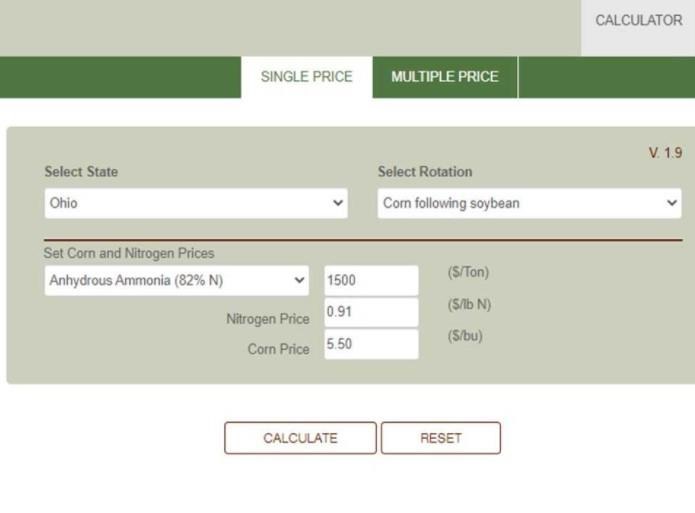
In the Corn Belt, the corn nitrogen rate calculator has been developed to generate these economic optimum rates. The purpose of this article is to help you understand what the corn nitrogen rate calculator is and how to use it. You can find the calculator at http://cnrc.agron.iastate.edu/ The calculator utilizes yield and rate data from on-farm and small plot research trials in Illinois, Indiana, Iowa, Michigan, Minnesota, Ohio and Wisconsin. The Ohio recommendations are based on nearly 300 corn nitrogen rate trials in the state. After selecting your state, you will need to select the crop rotation. See Figure 1. The third input is the source of nitrogen you will use and the price per ton you expect to pay. The final input is the price per bushel of corn at which you expect to sell your corn. Watch this short video to see how to use the Corn Nitrogen Rate Calculator.
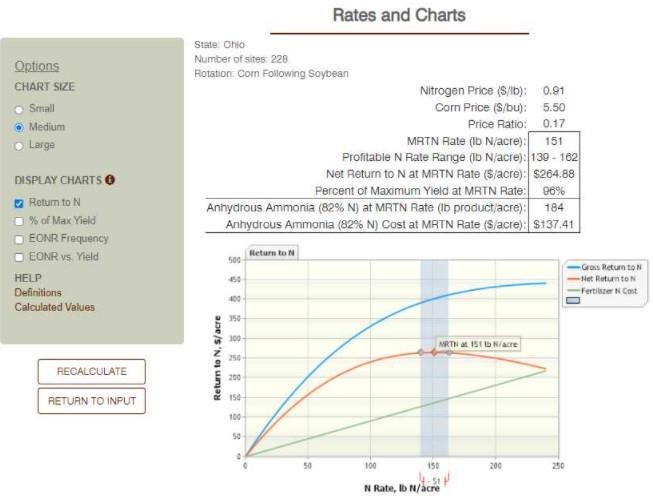
Once you click calculate, a return to nitrogen graph is presented with three different lines plotted: Gross Return to N, Net Return to N, and Fertilizer N Cost. The Net Return to N line is arguably the most important. It identifies the N rate where the last unit of added nitrogen has an economic return (EONR) or in other words, it identifies the last unit of N that creates profit for your farm, given the N price and corn price inputs. Additionally, the output page identifies a profitable N rate range that suggests a little bit of ‘wiggle room’ for your total N rate, often times 10-20 lbs of N above and below the EONR (aka MRTN).
At a very basic , but helpful level, the output page calculates your nitrogen price per pound based on the product price per ton input. Is nitrogen cost per pound $.90 or $.30 this year? Another basic calculation that the output page provides is the nitrogen-to-corn price ratio. In the 2021 growing season, many farmers had a nitrogen-to-corn price ratio below one tenth (.1). What is your price ratio this year? See Figure 2 for the outputs when $1,500/ton anhydrous is used in Ohio, corn after soybean rotation, and with an expected corn price of $5.50/bushel.
Source : osu.edu