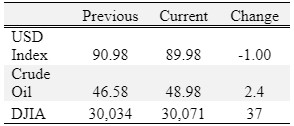
Overview
Corn, cotton, and soybeans were up; wheat was down for the week.
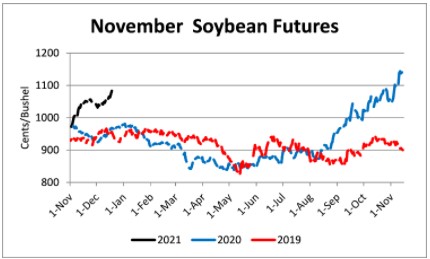
Moving toward 2021 there is a strong bullish trend in corn, soybean, cotton, and wheat markets. After an early December lull, soybeans have broken above the $12 mark and are poised to establish another leg up, possibly above $13. U.S. soybean stocks will be very tight in early 2021. Also, Brazil has faced weather challenges and also has very tight stocks before their harvest starts in January. This will continue to provide bullish influences in soybean markets and increased volatility. Consider for the 2020/21 marketing year, Brazil and the U.S. (the world’s largest exporters, accounting for 86% of global exports) are both likely to import small amounts of soybeans. It sounds strange, but due to the different harvest seasons, seasonal price differences, changes in currency value, and strong domestic crushing industries, we have seen Brazil import U.S. soybeans in November/December and the U.S. is likely to import soybeans June-August before the new crop is harvested. This demonstrates the tight global reserves and strong demand for soybeans.
March corn is within two cents of the November 30 high of $4.39 ½. Current projected corn stocks-to-use ratio (11.5%) is the lowest since the 2013/14 marketing year when it was 9.2%. While not nearly as tight as soybean stocks, the current projection of 1.7 billion bushels of ending stocks for the 2020/21 marketing year is nearly half of the May 2020 USDA ending stocks projection of over 3 billion bushels.
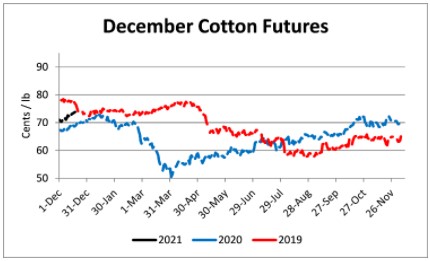
March cotton futures have continued the long term upward trend starting back on April 2 when prices bottomed at 51.64. Currently, prices are above 77 cents and are poised to take a run at 80 cents. A smaller 2020 US crop (average US upland cotton yield was dropped 6.9% by USDA from the November to December Crop Production report), strong export sales, and rising prices for row crops have contributed to recent movements in cotton futures. For now, large global cotton stocks of 99.52 million bales have not limited the current price gains, but could in early 2021.
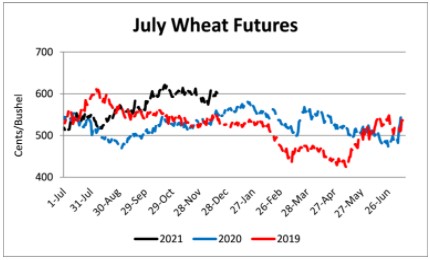
Wheat prices have been partially buoyed by raising corn prices and dry weather concerns causing prices to trade above $6.00. U.S. stocks are projected to decrease for the 4th consecutive year, but global stocks remain projected record large.
Corn
Ethanol production for the week ending December 11 was 0.957 million barrels per day, down 34,000 barrels from the previous week. Ethanol stocks were 22.95 million barrels, up 0.867 million barrels compared to last week. Corn net sales reported by exporters for December 4-10 were up compared to last week with net sales of 75.8 million bushels for the 2020/21 marketing year and 0.4 million bushels for the 2021/22 marketing year. Exports for the same time period were up 35% from last week at 38.0 million bushels. Corn export sales and commitments were 62% of the USDA estimated total exports for the 2020/21 marketing year (September 1 to August 31) compared to the previous 5-year average of 49%. Across Tennessee, average corn basis (cash price-nearby futures price) weakened at Northwest, and strengthened at North-Central, Mississippi River, West-Central, and West elevators and barge points. Overall, basis for the week ranged from 10 under to 32 over, with an average of 17 over the March futures. March 2021 corn futures closed at $4.37, up 14 cents since last Friday. For the week, March 2021 corn futures traded between $4.20 and $4.38. Mar/May and Mar/Dec future spreads were 2 and -19 cents. May 2021 corn futures closed at $4.39, up 13 cents since last Friday.
Corn | Mar 21 | Change | Dec 21 | Change |
Price | $4.37 | $0.14 | $4.18 | $0.06 |
Support | $4.21 | $0.06 | $4.09 | $0.04 |
Resistance | $4.38 | $0.10 | $4.17 | $0.02 |
20 Day MA | $4.26 | $0.01 | $4.11 | $0.02 |
50 Day MA | $4.18 | $0.03 | $4.02 | $0.02 |
100 Day MA | $3.92 | $0.05 | $3.91 | $0.03 |
4-Week High | $4.39 | $0.00 | $4.19 | $0.04 |
4-Week Low | $4.14 | $0.01 | $4.04 | $0.04 |
Technical Trend | Up | + | Up | + |
December 2021 corn futures closed at $4.18, up 6 cents since last Friday. Downside price protection could be obtained by purchasing a $4.20 December 2021 Put Option costing 35 cents establishing a $3.85 futures floor.
Soybeans
Net sales reported by exporters were up compared to last week with net sales of 33.9 million bushels for the 2020/21 marketing year and 3.5 million bushels for the 2021/22 marketing year. Exports for the same period were down 4% compared to last week at 95.1 million bushels. Soybean export sales and commitments were 90% of the USDA estimated total annual exports for the 2020/21 marketing year (September 1 to August 31), compared to the previous 5-year average of 68%. Across Tennessee, average soybean basis weakened at West-Central and strengthened at Mississippi River, West, North-Central, and Northwest elevators and barge points. Basis ranged from 6 under to 28 over the January futures contract. Average basis at the end of the week was 12 over the January futures contract. January 2021 soybean futures closed at $12.20, up 60 cents since last Friday. For the week, January 2021 soybean futures traded between $11.61 and $12.24. Jan/Mar and Jan/Nov future spreads were 4 and -139 cents. March 2021 soybean futures closed at $12.24, up 58 cents since last Friday. March 2021 soybean-to-corn price ratio was 2.80 at the end of the week.
Soybeans | Jan 21 | Change | Nov 21 | Change |
Price | $12.20 | $0.60 | $10.81 | $0.29 |
Support | $11.71 | $0.25 | $10.53 | $0.15 |
Resistance | $12.17 | $0.48 | $10.83 | $0.23 |
20 Day MA | $11.74 | $0.07 | $10.51 | $0.05 |
50 Day MA | $11.25 | $0.16 | $10.18 | $0.10 |
100 Day MA | $10.44 | $0.15 | $9.77 | $0.09 |
4-Week High | $12.23 | $0.23 | $10.84 | $0.24 |
4-Week Low | $11.42 | $0.04 | $10.22 | $0.00 |
Technical Trend | Up | + | Up | + |
November 2021 soybean futures closed at $10.81, up 29 cents since last Friday. Downside price protection could be achieved by purchasing an $11.00 November 2021 Put Option which would cost 91 cents and set a $10.09 futures floor. Nov/Dec 2021 soybean-to-corn price ratio was 2.59 at the end of the week.
Cotton
Net sales reported by exporters were down compared to last week with net sales of 402,900 bales for the 2020/21 marketing year and 13,800 for the 2021/22 marketing year. Exports for the same time period were down 55% compared to last week at 251,300 bales. Upland cotton export sales were 73% of the USDA estimated total annual exports for the 2020/21 marketing year (August 1 to July 31), compared to the previous 5-year average of 68%. Delta upland cotton spot price quotes for December 17 were 74.44 cents/lb (41-4-34) and 76.69 cents/lb (31-3-35). Adjusted World Price (AWP) increased 2.73cents to 60.9 cents. March 2021 cotton futures closed at 77.16, up 3.08 cents since last Friday. For the week, March 2021 cotton futures traded between 74.2 and 77.41 cents. Mar/May and Mar/Dec cotton futures spreads were 0.67 cents and -3.26 cents. May 2021 cotton futures closed at 77.83 cents, up 2.94 cents since last Friday.
Cotton | Mar 21 | Change | Dec 21 | Change |
Price | 77.16 | 3.08 | 73.90 | 1.53 |
Support | 74.80 | 2.81 | 72.42 | 1.22 |
Resistance | 78.60 | 2.87 | 74.70 | 1.42 |
20 Day MA | 73.49 | 1.17 | 71.73 | 0.89 |
50 Day MA | 71.99 | 0.85 | 70.44 | 0.67 |
100 Day MA | 68.85 | 0.70 | 67.76 | 0.59 |
4-Week High | 77.41 | 2.66 | 74.10 | 1.25 |
4-Week Low | 71.07 | 0.89 | 70.10 | 1.41 |
Technical Trend | Up | = | Up | = |
December 2021 cotton futures closed at 73.9 cents, up 1.53 cents since last Friday. Downside price protection could be obtained by purchasing a 74 cent December 2021 Put Option costing 5.41 cents establishing a 68.59 cent futures floor.
Wheat
Wheat net sales reported by exporters were down compared to last week with net sales of 19.9 million bushels for the 2020/21 marketing year and 0.8 million bushels for the 2021/22 marketing year. Exports for the same time period were down 57% from last week at 8.8 million bushels. Wheat export sales were 74% of the USDA estimated total annual exports for the 2020/21 marketing year (June 1 to May 31), compared to the previous 5-year average of 74%. March 2021 wheat futures closed at $6.08, down 6 cents since last Friday. March 2021 wheat futures traded between $5.89 and $6.22 this week. March wheat-to-corn price ratio was 1.39. Mar/May and Mar/Jul future spreads were 1 and -5 cents. May 2021 wheat futures closed at $6.09, down 5 cents since last Friday.
Wheat | Mar 21 | Change | Jul 21 | Change |
Price | $6.08 | -$0.06 | $6.03 | -$0.04 |
Support | $5.98 | $0.19 | $5.95 | $0.15 |
Resistance | $6.19 | -$0.18 | $6.11 | -$0.14 |
20 Day MA | $5.94 | $0.00 | $5.94 | -$0.01 |
50 Day MA | $6.04 | $0.01 | $6.00 | $0.01 |
100 Day MA | $5.77 | $0.03 | $5.77 | $0.03 |
4-Week High | $6.22 | $0.00 | $6.15 | $0.00 |
4-Week Low | $5.65 | $0.00 | $5.70 | $0.00 |
Technical Trend | Up | = | Up | = |
In Tennessee, new crop wheat cash contracts ranged from $5.82 to $6.18. July 2021 wheat futures closed at $6.03, down 4 cents since last Friday. Downside price protection could be obtained by purchasing a $6.10 July 2021 Put Option costing 48 cents establishing a $5.62 futures floor.
Source : tennessee.edu