North Carolina and Tennessee lead the country in terms of corn in this stage
By Diego Flammini
Assistant Editor, North American Content
Farms.com
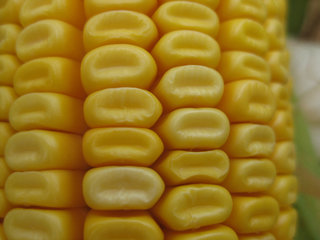
The percentage of the total U.S. corn crop in the dough stage increased by 19 percent since last week, according to the United States Department of Agriculture’s (USDA) latest Weekly Weather and Crop Bulletin for the week ending August 13.
Last week, the percentage of American corn in the dough stage was 42 percent. That number has jumped to 61 percent, only 1 percent lower than the five-year average.
On a state level, corn fields in North Carolina and Tennessee lead the U.S. with 95 and 90 percent, respectively, of their crops in the dough stage.
The state with the lowest percentage of corn in the dough stage is Colorado at 25 percent.
And Nebraska experienced the largest increase in corn crops entering the dough stage.
65 percent of the crop is currently at the dough stage, up from 40 percent last week.
Corn fields across the U.S. also continue to dent, according to the USDA’s report.
16 percent of the total corn crop is dented, up from 7 percent last week. This figure, however, is down slightly from the five-year average of 20 percent.
North Carolina leads the U.S. with 79 percent of its corn crop dented.
On the other end of the scale, Colorado and Pennsylvania have only 1 percent of their corn crops dented.
And the USDA rated 49 percent of the total corn crop as good. Another 13 percent is excellent.
Wheat
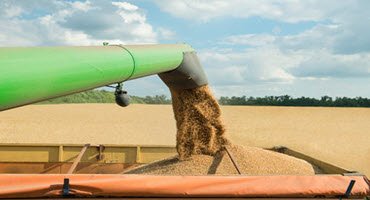
U.S. farmers have almost completed their winter wheat harvest.
Producers have combined 97 percent of the total winter wheat, according to the USDA’s report.
That number is up 3 percent from last week and only 1 percent shy of the five-year average.
Producers in 10 states, including Illinois, Indiana, Ohio and Oklahoma, have completed their winter wheat harvest.
With 74 percent of their winter wheat harvested, farmers in Washington have the lowest percentage completed.
And farmers have combined 40 percent of their spring wheat crop, the USDA reports.
That number is up from 24 percent last week and 5 percent higher than the five-year average.
Growers in South Dakota have harvested 79 percent of their spring wheat crop, which is the most of the six states recorded.
At the other end of the scale, farmers in Minnesota have harvested the lowest percentage of the spring wheat crop at 26 percent.
But that number does represent an increase from 9 percent last week.
The USDA reported 27 percent of the total spring wheat crop is good and another 6 percent as good.
Soybeans
The percentage of U.S. soybeans setting pods across the country jumped by 14 percent since last week, according to the USDA.
Last week, 65 percent of the total U.S. soybean crop had set pods. That number now sits at 79 percent.
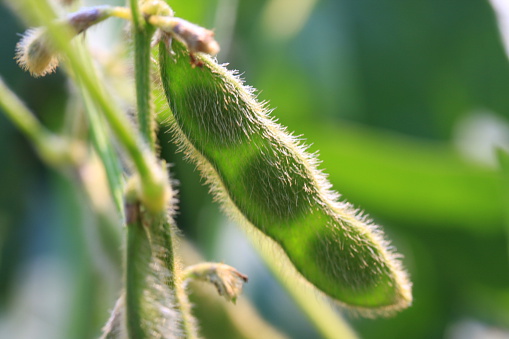
Soybeans in Louisiana lead the nation, in terms of setting pods, with 99 percent of fields at this stage.
Fields in Kentucky have the lowest percentage of soybeans setting pods at 60 percent.
Soybean fields are also finished blooming, according to the USDA.
94 percent of the total soybean crop has bloomed, up from 90 percent last week and up 1 percent from the five-year average.
At 79 percent, Kentucky has the lowest percentage of soybeans blooming of the 18 states documented.
And USDA ranked 49 percent of the total soybean crop as good. Another 10 percent is rated excellent.
Fieldwork Days
The states with the highest amount of suitable fieldwork days for the week ending August 13 were:
- California, Nevada, Arizona, Maine and Rhode Island – 7
- Idaho – 6.8
- Montana – 6.7
- Utah – 6.5
The states with the fewest amount of suitable fieldwork days were:
- Mississippi – 1.8
- Louisiana – 2.2
- Alabama and New Mexico – 3.9
- Vermont – 4
Weekly Precipitation Levels
State | Precipitation (inches) | Weather Station |
Illinois | 0.62 | Springfield |
Indiana | 1.54 | Evansville |
Iowa | 0.53 | Burlington |
Kentucky | 2.03 | Jackson |
Michigan | 0.47 | Traverse City |
Missouri | 3.11 | Springfield |
New York | 0.98 | Albany |
Pennsylvania | 1.33 | Allentown |
Tennessee | 2.57 | Knoxville |
The next Weekly Weather and Crop Bulletin is scheduled for release on Tuesday, August 22.