By Trent Ford
Illinois State Climatologist
Illinois State Water Survey, Prairie Research Institute
University of Illinois
Although perhaps not as challenging as 2019, the 2020 Illinois growing season weather was remarkable. From late spring and early fall freezes, to wet-dry-wet swings, to drought that visited most of the state, and even a derecho, in this article I will review the 2020 growing season weather from a climatological perspective.
Cool, Wet Spring – But Not 2019
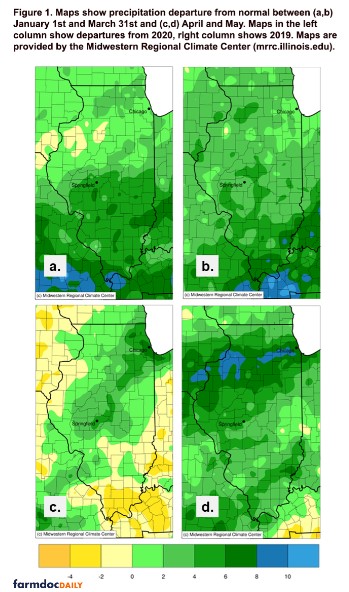
Coming off of the fifth wettest calendar year on record statewide in 2019, most folks were concerned about a repeat of exceedingly wet conditions this spring. The first three months of the year together were wetter than average for virtually the entire state, and even wetter than January – March 2019 in southern Illinois (Figures 1a, 1b). National Weather Service outlooks at the end of February showed most gauges along the Mississippi River in Illinois were likely to reach major flood stage between March and May.
Although April and May were wetter than average across Illinois (Figures 1c, 1d), both months had 2-3 week dry spells during which most of the state remained dry. These two time periods, the first three weeks of April and the first two weeks of May, allowed planting to progress much ahead of the 2019 growing season.
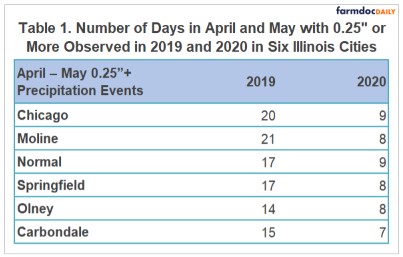
The dry spells were broken up by heavy rainfall events toward the end of April and middle to end of May which forced several producers to replant early-planted corn and beans. However, at the state scale the beginning of the 2020 growing season did not bring the widespread challenges related to excess moisture that characterized 2019. Table 1 sheds some light on these differences, expressed as the frequency of days in April and May with at least a quarter of an inch of precipitation observed in 2019 and 2020 in six locations. In Moline, for example, there was at least 0.25 inches observed in 21 out of 61 days between April 1st and May 31st in 2019, compared to 8 out of 61 days in 2020.
From a temperature perspective, the statewide average temperature for April and May together was nearly 2 degrees below the 30-year normal and 24th coldest on record back to 1895. The cold spring was capped off by a late season freeze in the second week of May, during which below freezing temperatures were observed as far south as Hardin County. The station in Normal recorded a 24-degree minimum temperature on May 10th, which was the second lowest May temperature observed at that station since measurements began there in 1893. The late spring freeze caused some isolated damage to early-planted beans as well as some damage to apple trees and berries in northern and central Illinois.
Hot, Humid June & July
The end of spring and beginning of summer marked a noticeable change in weather, with a shift to warmer, more humid conditions across most of the state. Statewide average temperatures in both June and July were approximately 2 degrees above the 30-year normals for those months. The persistence of warmer than normal temperatures in June and July was noteworthy, as exhibited by the daily mean temperature departures observed between June 1st and July 31st in Rockford (Figure 2). Nearly 80% of June and July days in Rockford were warmer than normal, including a stretch in late June and early July of 13 consecutive days with daily average temperature more than 4 degrees above the 30-year daily normals. The warm weather in June and July helped accumulate growing degree days after degree day deficits formed due to cold weather in April and May.
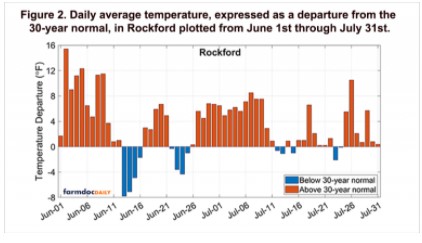
High temperatures were accompanied by persistently elevated humidity due to atmospheric flow off of the Gulf of Mexico and actively transpiring crops. The heat and humidity were responsible for 31 daily high minimum temperature records broken including a record 76-degree minimum temperature in Olney on June 10th. The daily average July heat index value in Belleville was 87.2 degrees, which was the second highest July average heat index value on record, after 2011.
Summer Precipitation Variability
Precipitation between June 1st and September 30th was within 2 inches of the long-term average across most of the state (Figure 3). Parts of northeast and central Illinois were much drier than average over this time period, while most of far southern Illinois and the St. Louis Metro East region remained wetter than average.
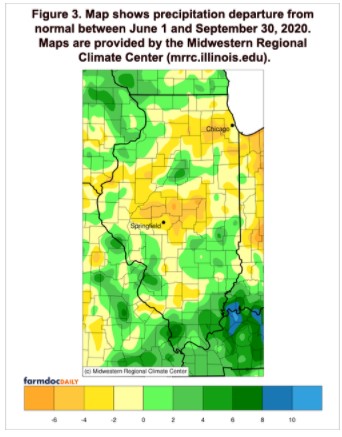
However, the wide-view perspective of summer rainfall is somewhat misleading given the remarkable precipitation variability during the 2020 growing season. The central and northern thirds of the state spent the majority of June through September in moisture deficit. Multiple, prolonged dry spells were broken up by extreme precipitation that in some cases flooded crops. For example, following the 11th driest June on record in Peoria County, the station at the Peoria airport recorded 5.15 inches in just six hours on July 15th, marking the highest six-hour rainfall total on record in Peoria. The same storm system produced 24-hour rainfall totals exceeding 6 inches in parts of central Illinois, resulting in widespread flash flooding in agricultural and residential areas. The station in Minonk in Woodford County, for example, recorded 6.5 inches on July 15th. This day, along with a 9-inch rainfall observation in September of last year, are the only two days in Minonk’s 125-year record with more than 6 inches of rainfall observed. July ended as the 8th wettest on record in Tazewell County, following the County’s 7th driest June.
While drought appeared in northern and central Illinois in July, the southern third of the state remained wet. July was the 2nd wettest on record in Belleville in St. Clair County, followed by the wettest August on record in Belleville. However, as late August rains helped alleviate drought in northern Illinois, most of southern Illinois remained dry through most of September. As a result, the wettest August on record in Belleville was followed by the location’s 7th driest September.
Precipitation extremes, both too much and too little, can have significant impacts on crops, and these impacts are magnified when these extremes occur within a short time period, as they did this year. Crops in many parts of the state experienced prolonged moisture deficit between June and September as a result of repeated dry spells; however, these dry spells were broken by extreme rainfall that flooded fields and inundated crops. The rapid change from very dry to very wet likely impacted yields this season.
Chasing Drought
Most of the state experienced some form of drought and/or drought-related agricultural impacts during the 2020 growing season. However, multiple, timely precipitation events prevented drought conditions from persisting, as they did in western and central Iowa. Figure 4 shows U.S. Drought Monitor (https://droughtmonitor.unl.edu/) maps from four growing season weeks, showing how drought rapidly appeared and disappeared during this growing season.
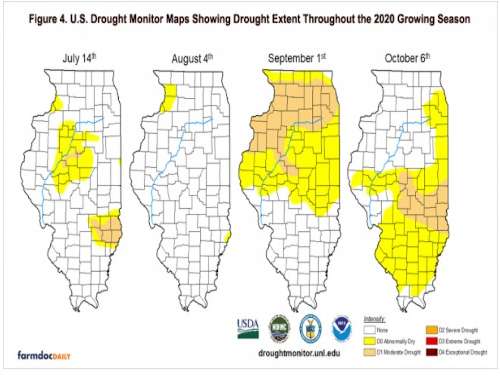
The lack of June rain resulted in moderate drought in central and southeast Illinois; this was the first week with moderate drought since October 2019. Intense rainfall in mid-July alleviated the dry conditions in these areas, and the state was drought free in the beginning of August. Multiple, dry weeks combined with very high temperatures in late August resulted in rapid onset or “flash” drought in northern Illinois by the end of the summer. September brought much-needed rain and drought alleviation in northern Illinois. However, September was very dry in southern Illinois, resulting in re-introduction of drought and abnormally dry conditions in the southern half of the state.
The quick change between dry and wet conditions presented a whack-a-mole kind of drought pattern, dissimilar from noteworthy growing season such as 2012 when drought persisted and intensified throughout the growing season.
August Derecho
The most noteworthy weather event in the Midwest during the 2020 growing season was undoubtedly the August derecho. On August 10th, a strong mesoscale convective system moved across the Upper Midwest. The system intensified in the eastern Dakotas and caused a derecho – a widespread, long-lived windstorm – that impacted areas of Iowa, Illinois, Wisconsin, and Indiana. A derecho is characterized by strong straight-line winds that can exceed 75 mph and often affect areas between 250 and 500 miles. The August 10th derecho produced observed winds exceeding 100 mph and estimated (from damage) wind gusts up to 140 mph across east-central Iowa. Based on initial reports and satellite imagery analysis, the derecho damaged between 6 and 10 million acres of crops across Iowa and northern Illinois. Crop damage from straight-line winds and hail were reported in northern Illinois, although the damage was not nearly as extensive as that in eastern Iowa.
In addition, the winds caused significant damage and destruction in residential and urban areas. The city of Cedar Rapids, Iowa was hit particularly hard. The local newspaper reported estimates of over 20,000 trees downed in Cedar Rapids alone (The Gazette, 2020), causing hundreds of thousands to lose power and remain without power for several days. Along with the derecho, the storm produced 15 confirmed tornadoes in the Chicagoland area.
Early Frost
A strong cold front moved across the Midwest in early October, bringing very cold air into the region. Many areas of the state saw their first widespread frost on the morning of October 5th, bringing an end to the 2020 growing season. Below freezing temperatures were observed that morning as far south as Carbondale, and stations from Aurora to Belleville observed temperatures at or below the hard freeze threshold of 28°F. This first fall freeze came approximately 1 to 2 weeks earlier than the long-term median date in northern and central Illinois, and 3 to 4 weeks early in southern Illinois.
The combination of a late spring freeze in May and early fall freeze in October in eastern Illinois resulted in an unusually short growing season. For example, only 147 days elapsed between the last spring freeze and first fall freeze in Olney this year, 36 days shorter than the long-term average, and the 2nd shortest growing season on record in Olney going back to 1897. Likewise the 2020 growing season was the 6th shortest in Champaign (148 days), 5th shortest in Paris (145 days), and 11th shortest in Hoopeston (148 days).
Conclusion
Although not as demanding as last year, the 2020 growing season weather presented its own set of challenges. The relatively short growing season was marked by persistent dryness – broken up by a handful of intense precipitation events – and an extraordinary derecho. Fortunately, the latter half of September and first half of October have been very dry statewide. This has helped harvest progress on or ahead of schedule, quite a contrast from last year.
Source : illinois.edu