By Gregg Ibendahl
Department of Agricultural Economics
Kansas State University
Introduction
This paper builds on Ibendahl’s paper from last week of estimating corn yields in the U.S. The USDA collects the crop conditions each week for both corn and soybeans and both sets of estimates are published for the major crop producing states on Monday afternoons. The soybean crop is rated as either: very poor, poor, fair, good, or excellent and is reported as the percentage of state crop acres in each category.
Procedure
The same model used to estimate corn production is used in this soybean model. First a CCIndex is constructed where:
CCIndex = (% acreage Excellent) * 1 +
(% acreage Good) * 0.75 +
(% acreage Fair) * 0.50 +
(% acreage Poor) * 0.25 +
(% acreage Very poor) * 0
This CCIndex for each state is used in a regression analysis of the last 30 years to estimate the deviation from trend line soybean yields for each state. The regression analysis is specific to a given week each year. In this paper, data for week #30 is used for the regression analysis from each state. Because the regression analysis is unique for each week, the model here will be different than a model in future or previous weeks. Ibendahl’s corn estimation paper used week #29 as the basis.
This soybean estimation paper is also different as the June soybean estimation of the USDA was used for the acres in each state. The corn model used a separate procedure to estimate harvest acres but that procedure provided little value to the model, so it was simplified to just the June USDA number.
Results
Figure 1 is a Likert graph of the soybean crop conditions for the last 20 years in the U.S. for the last 20 years. This national number is provided by the USDA in addition to the individual state numbers. The Likert graph has the percent of crop acres in the very poor and poor categories listed on the left-hand-side while the number of acres in the good and excellent categories is listed on the right-hand-side. The Likert graph is centered on the fair category which has the percentage listed in the center of the column.
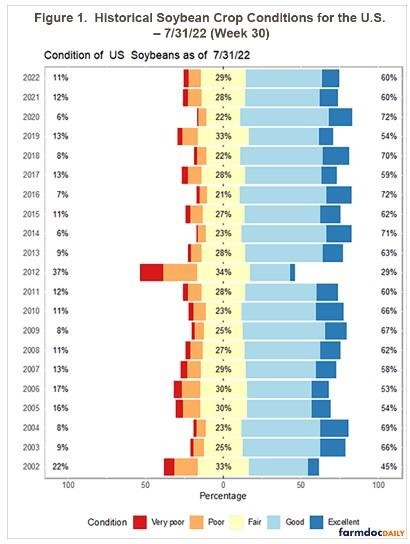
As Figure 1 illustrates, 2022 appears to be close to a typical year. In fact, 2022 is almost identical to 2021 at the end of July. However, as will be shown below, the expected national yield is lower than last year because the biggest soybean states are expected to have yields lower than last year. This pushes the national soybean yield per acre down even though the national crop conditions look the same.
Table 1 shows the estimated yield per harvested acre prediction along with the confidence intervals for each state as of 7/31/22 (week 30.). This estimation is based on 30 years of observations from week #30. The R-square values will improve as the season progresses, but the estimates are still not nearly as good as the corn estimates. Soybeans, along with wheat, are more difficult crops to estimate for yields and much can happen before harvest.
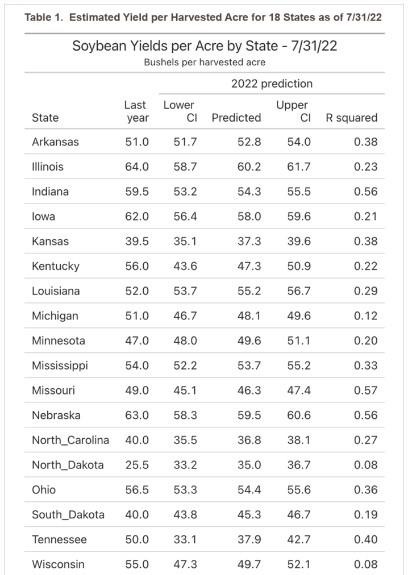
Table 2 shows the harvest acres from last year, the planted soybean acres this year, and the USDA June soybean estimate of acres. As discussed above, trying to estimate harvested acres from the June estimate didn’t provide anything that would improve just using the June estimate. Both the USDA national soybean acres and the 18 major soybean states scaled to a national level are expected to increase by 1.4% from last year.
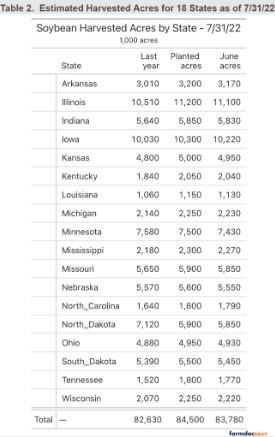
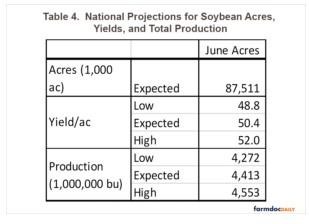
Table 3 shows the estimated soybean production by state and is the result of multiplying the June acre estimate by the expected yields. Because yields in some of the major soybean growing areas are estimated to be lower, total production is expected to be 0.49% lower even though acres are expected to be higher. Total production when scaled to a national level is expected to be 4.413 billion bushels with a range from 4.272 billion bushels to 4.553 billion bushels. This range is from 3.65% lower than last year to 2.67% higher than last year.
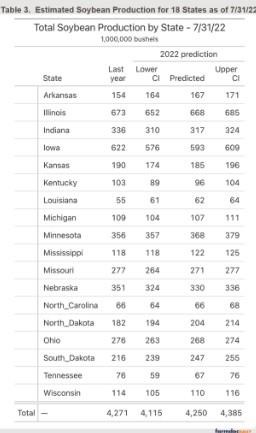
Table 4 lists these estimated national numbers. Table 4 also shows the calculated yield per acre. Last year, the national yield per acre was 51.4 bushels per acre. This year, the national yield per acre is expected to be a full bushel lower at 50.4 bushels per acre with a range from 48.8 to 52.0 bushels per acre. A follow-up article will be written sometime in August to update these estimates.
Source : illinois.edu