By Gary Schnitkey and Nick Paulson et.al
Department of Agricultural and Consumer Economics
University of Illinois
By Carl Zulauf
Department of Agricultural, Environmental and Development Economics
Ohio State University
Corn and soybean yields for the years from 2015 to 2019 are shown for Crop Reporting Districts (CRDs) in the Midwest. Also reported are corn-to-soybean yield ratios. Overall, corn-to-soybean yield ratios tend to be higher in the western corn belt in Iowa, Minnesota, and the eastern Dakotas. Lower corn-to-soybean yield ratios typically occur in the eastern corn belt. Thus, acres of corn and soybeans are unevenly distributed, with areas with higher corn-to-soybean yield ratios having higher more corn than soybean acres, and vice versa.
Corn and soybean production predominates in the center of the corn belt. As other crops, irrigation, and livestock have more of influence, factors other than relative corn and soybean yields will have more impacts in areas outside the center of the corn belt. Overall though, higher relative soybean yields likely will result in more soybeans acres in the eastern corn belt, as relative yields favor soybean profitability. Conversely, higher relative corn yields likely will result in more of corn acres in the western corn belt.
Average Crop Reporting District Yields from 2015 through 2019
Corn and soybean yields for the years from 2015 to 2019 were obtained from Quick Stats, a website maintained by the National Agricultural Statistical Service (NASS), an agency of the U.S. Department of Agriculture. These yields were averaged from 2015 through 2019 to dampen the impacts of geographically related weather events, thereby providing a better representation of the average yields within the CRD regions. With the exception of 2019, the period from 2015 to 2019 was a period of good overall yields.
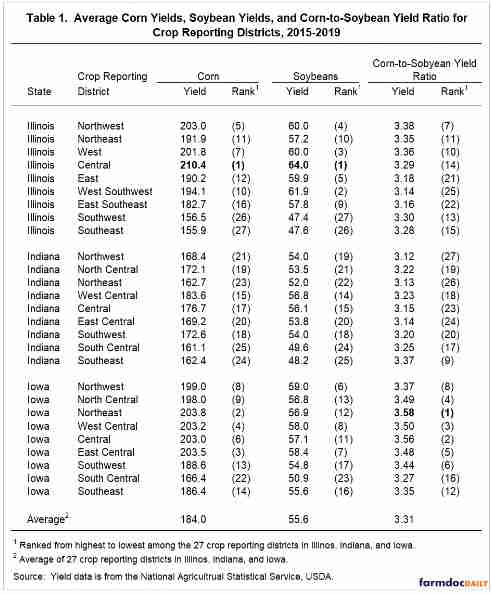
Table 1 reports yield averages for the 27 CRDs in Illinois, Indiana, and Iowa, the “I-states” in the heart of the corn belt. Also reported is the corn-to-soybean yield ratio, which equals the average corn yield divided by the average soybean yield. Take, for example, the Central CRD in Illinois. The Illinois Central CRD has a 210.4 bushel per acre average corn yield, a 64.0 bushel per acre soybean yield, and a 3.29 corn-to-soybean yield ratio (3.29 = 210.4 corn yield / 64.0 soybean yield). Higher yield ratios indicate that corn is relatively more productive than soybeans, and vice versa. Generally, corn will be relatively more profitable than soybeans in areas where corn-to-soybean yield ratios are higher, and vice versa. As a result, areas with higher yield ratios will more corn acres than soybean acres, and vice versa. Conversely, areas with lower yield ratios will tend to have more soybeans .
Corn Yields
From 2015 to 2019, the CRD with the highest average corn yield in the I-state was 210.4 bushels per acre in the Central CRD in Illinois. The next three highest yields occurred in CRDs in Iowa:
- Northeast CRD at 203.8 bushels per acre,
- East Central CRD at 203.5 bushels per acre, and
- West Central CRD at 203.2 bushels per acre.
The CRD with the fifth-highest average yield was the Northwest CRD in Illinois at 203.0 bushels per acre.
In the I-states, the lowest yielding CRDs were in southern Illinois and southern Indiana. The two lowest average yields were 155.9 bushels per acre in Southeast CRD in Illinois and 156.5 bushels per acre in Southwest CRD in Illinois. South Central CRD in Indiana has a 161.1 bushel per acre yield, and the Southeast CRD in Indiana had a 161.1 bushel per acre average.
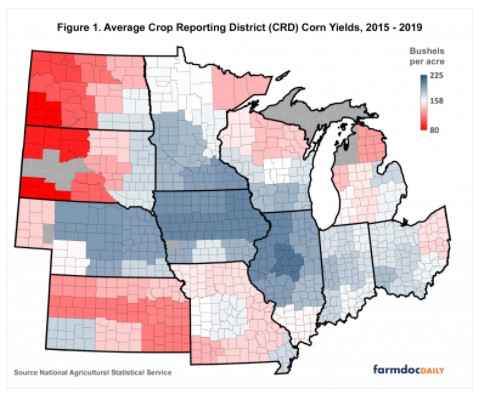
Figure 1 shows average corn yields not only for CRDs in the I-states but also across the Midwest. The highest corn yields were in central Illinois, extending west through western Illinois, northern and central Iowa, into Nebraska. Yields tend to be lower the further one moves from the center of the Corn Belt. When compared to the larger Midwest, southern Illinois and southern Indiana had close to average yields. Lower yields occurred in Missouri; Kansas; western North Dakota, South Dakota, and Nebraska; northern Minnesota and Wisconsin; many CRDs in Michigan; and eastern Ohio.
Soybean Yields
As with corn, the CRD with the highest soybean yields is the Central District in Illinois at 64.0 bushels per acre. The next four highest-yielding soybean CRDs also were all in Illinois:
- West Southwest CRD at 61.9 bushels per acre,
- West CRD at 60.0 bushels per acre.
- Northeast CRD at 60.0 bushels per acre, and
- East CRD at 59.9 bushels per acre.
In the I-states, the lowest yielding districts were in southern Illinois and southern Indiana. The two lowest yielding CRDs were in southern Illinois: Southwest CRD at 47.4 bushels per acre and Southeast CRD at 47.6 bushels per acre. The next two lowest CRDs were in southern Indiana: Southeast CRD at 48.2 bushels per acre and South Central CRD at 49.6 bushels per acre. These four CRDs have significant amounts of double-crop soybeans, which may pull down yields.
Figure 2 shows the average soybean yields across the Midwest. The highest soybean yields were in Central CRD in Illinois and then moved through northern and central Iowa and Nebraska. Some of the higher soybean yields occurred in Nebraska.
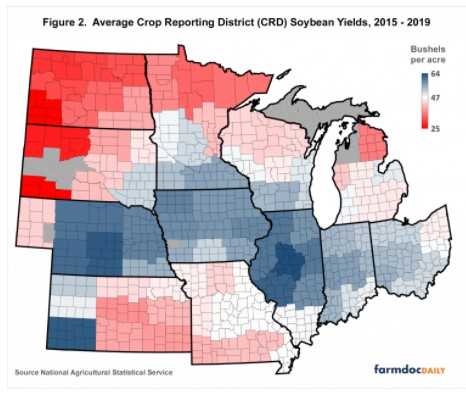
For the I-states, the lowest yields were in southern Illinois and southern Indiana. When compared to the Midwest, southern Illinois and southern Indiana had close to average yields, similar to corn. Lower yields occurred in Missouri, eastern and central Kansas, western South Dakota, North Dakota, northern Minnesota and Wisconsin, Michigan, and eastern Ohio.
Corn-to-Soybean Yield Ratios
Over the entire Midwest, the average corn-to-soybean yield ratio was 3.39. Ratios exhibited spatial patterns, as is illustrated in Figure 3. Note that the central CRD in Illinois had the highest average corn and soybean yields, respectively, at 210.4 and 64.0 bushels per acre. Its corn-to-soybean yield ratio of 3.29 was near the average for the I-states. In the I-states, higher corn-to soybean ratios tend to be located west and north of Illinois’ Central CRD, in western Illinois and northern and central Iowa. Overall, one would expect corn to be more of an advantage in these areas relative to soybeans. In the I-states, lower corn-to-soybean rations tend to be east and south of the central CRD in Illinois: in southern and eastern Illinois and most of Indiana. Overall, one would expect soybean to have a relative economic advantage in these areas relative to corn.
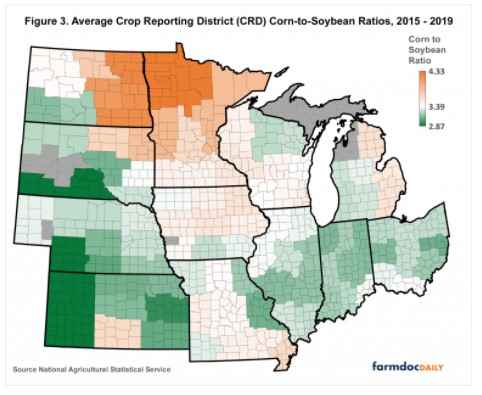
Outside the I-states, geographical trends continue. The eastern corn belt of Indiana and Ohio tend to have lower corn-to-soybean yield ratios. Western Kansas and western Nebraska also had low ratios. Higher corn-to-soybean yield ratios tend to be in Iowa, much of Wisconsin, Minnesota, and eastern North and South Dakota.
Summary
Across the Midwest, higher yields for both corn and soybeans tend to predominate in the heart of the corn belt. Higher corn yields relative to soybean yields tend to predominate in Iowa, Minnesota, and eastern Dakotas. Higher soybean yields relative to corn yields tend to predominate in the eastern corn belt and parts of the Great Plains. If soybean prices suggest that soybeans will be more profitable than corn, more of the shift to soybeans likely will occur in areas with lower corn-to-soybean yield ratios, particularly in the I-states. Corn and soybean production tend to predominate in the I-states. Other factors are more likely to come into play in other regions. Similarly, if prices suggest corn will be more profitable than soybeans, more of the acreage shift likely will occur in those areas with higher corn-to-soybean yield ratios.
Source : illinois.edu