By Nick Paulson and Krista Swanson et.al
Department of Agricultural and Consumer Economics
University of Illinois
Carl Zulauf
Department of Agricultural, Environmental and Development Economics
Ohio State University
The harvest-time futures contracts for corn and soybeans continue to trade at levels well above those experienced since 2013. In a recent article (farmdoc daily, May 11, 2021), we used the farmdoc Price Discovery Tool to illustrate downside price risk based on market-based assessments at that time. Today’s article extends this analysis to consider downside risks, and upside potential, associated with harvest revenue using simulation methods tailored to a central Illinois scenario. Increased price volatility relative to recent years and continued uncertainty surrounding crop yields result in the potential for significant revenue declines from current expectations. Still, the chances of high revenue levels providing excellent returns for 2021 are quite likely.
Simulation Description
Simulation methods are used to model a typical commercial grain farm in Champaign County, Illinois. Settlement prices for the 2021 harvest contracts (December for corn, November for soybeans) along with option prices as of June 14th, 2021 were used to define lognormal price distributions from which 5,000 prices for corn and soybeans were drawn. The expected harvest prices are $5.81 for corn and $13.95 for soybeans. Price volatilities – measures of price variability – are 28% for corn and 15.5% for soybeans.
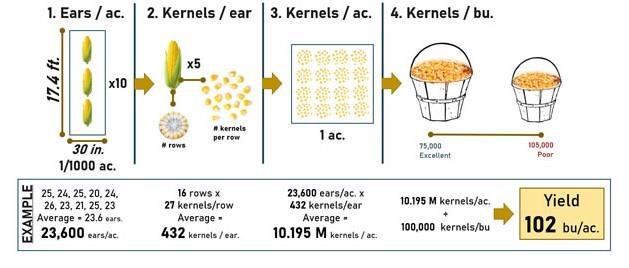
Trend yield estimates of 200 bushels per acre for corn and 65 bushels per acre for soybeans were assumed based on historical yield data for Champaign County. Crop insurance rates for Champaign County were used to define Weibull distributions from which 5,000 random corn and soybean yields were drawn. Just like options prices reflect the volatility of prices, crop insurance rates can be used to reflect the potential volatility or variability in crop yields.
Finally, negative correlation between the simulated harvest prices and yields was imposed to account for the historical relationship between realized yields and prices. Negative correlation recognizes the fact that price tend to move down (up) when production levels are high (low). This results in below average yields tending to be paired with above average prices, and vice versa. Each of the simulated yields and prices were then multiplied together to provide a distribution of 5,000 potential revenue levels that could be realized at harvest based on market-based assessments of variability in prices (futures and options) and yields (crop insurance rates).
Corn Revenue
Figure 1 shows the probability distribution of harvest corn revenues based on the simulation. Expected harvest revenue for corn is just over $1,100 per acre, which can be seen in Figure 1 from the bars around $1,100 being in the middle of the distribution and having the greatest likelihood (bars are the highest). The spread in the distribution provides a sense of how likely revenue levels below (or above) the expected revenue might occur. Revenue levels become less likely the further they move away from, below or above, the expected level. Figure 1 illustrates that, while relatively unlikely, harvest revenue levels below $500 per acre are possible based on current market assessments for prices and potential yield variability in Champaign County. Corn revenues approaching $2,000 per acre are also possible, but relatively unlikely.
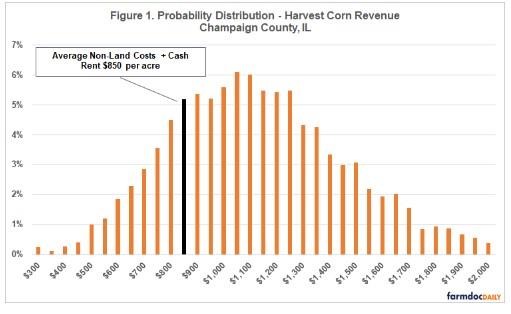
Figure 2 provides an alternative way of illustrating the harvest revenue distribution for corn using a cumulative distribution function (cdf). The values plotted on the cdf can be interpreted as the probability or likelihood that actual revenue will be at or below a certain level. For example, the value of the corn revenue cdf at $1,100 is just over 50%. There is roughly a 50% chance that harvest revenue for corn will be less than $1,100, but also a 50% chance that harvest revenue will exceed $1,100.
The simulation for Champaign County corn revenue without insurance suggests:
- A 14% chance that harvest revenue could be below $750 per acre
(Note: $750 per acre would be around the lowest average revenue level for corn in central IL since 2013)
- A 24% chance that harvest revenue could be below $850 per acre
(Note: $850 per acre is roughly equal to total non-land costs plus cash rents for corn in central Illinois based on the most recent 2021 crop budgets)
- A 37% chance that harvest revenue will exceed $1,200 per acre
(Note: $1,200 per acre was roughly the record-high average revenue level for corn in central IL in 2011 and 2012)
- A 13% chance that harvest revenue will exceed $1,500 per acre
To illustrate how crop insurance might impact the downside risk associated with harvest revenue, an 85% Revenue Protection (RP) policy was also considered using the 2021 projected price of $4.58 and trend-adjusted Actual Production History Yield (TA-APH) of 200 bushels per acre. This provides a minimum revenue guarantee of $779 acre (0.85 x $4.58 x 200). The guarantee could increase if the harvest price exceeds the projected price. Since futures are currently trading well above the projected price, the chances of guarantee increases for RP policy is relatively high (roughly 20-25%) compared to the price discovery period in February when markets were lower. This has the effect of reducing chances of low revenue levels:
- A 34% chance of indemnity payments from an RP-85 policy
- A 0% chance of harvest revenue below $779 per acre
- A 13% chance of harvest revenue below $850 per acre
Soybean Revenue
The probability distribution for simulated soybean revenue is provided in Figure 3. Expected soybean revenue is roughly $900 per acre. The revenue outcomes from the simulation exercise range from less then $300 per acre to more than $1,500 per acre. While revenues well below, or above, the expected level are possible they become less likely the further from expected revenues they become.
Figure 4 provides the cdf for soybean revenue. Again, the value of the cdf at the expected soybean revenue of $900 is about 50% – the chances of soybean revenues below $900 are about equally likely to revenues above $900 per acre.
The simulation for Champaign County soybean revenue suggests:
- A 12% chance of harvest revenue below $650 per acre
(Note: $650 per acre would be around the lowest average revenue level for soybeans in central IL since 2013, and is roughly equal to average total non-land costs plus cash rent for soybeans in central Illinois based on the most recent 2021 crop budgets)
- A 33% chance of harvest revenue below $800 per acre
(Note: $800 per acre was the record-high average revenue for soybeans in central Illinois in 2013)
- A 30% chance that harvest revenue will exceed $1,000 per acre
- A 4% chance that harvest revenue will exceed $1,250 per acre
An 85% RP policy for soybeans would provide a minimum harvest revenue guarantee of $656 per acre (0.85 x $11.87 projected price x 65 bu TA-APH). Including 85% RP payments reduces the likelihood of lower harvest revenues:
- A 27% chance of indemnities being triggered by an 85% RP policy
- A 0% chance of revenue below $656 per acre
- A 22% chance of revenues below $800
Conclusions
Volatility in futures and options markets for corn and soybeans continue to suggest potential for large price movements between now and harvest. Furthermore, significant uncertainty still surrounds 2021 crop yields. Considering the potential variability in both prices and yields results in a wide range of harvest revenue levels that could occur for corn and soybeans. A simulation exercise tailored to a central Illinois scenario shows that there is a high likelihood that harvest revenues for corn and soybeans will be at their highest levels since 2013.
As of June 14th, expected harvest revenue for corn in central Illinois would be somewhere around $1,100 per acre for corn and $900 per acre for soybeans. Price and yield combinations that result in revenues below those values are roughly equally likely to combinations that would result in harvest revenues above those expectations.
In terms of downside risk, there is 12-14% chance that harvest revenues could be below even some of the lowest levels experienced since 2013 ($750 per acre for corn; $650 per acre for soybeans). In those cases, crop insurance protection would be highly likely to trigger support to offset those revenue declines. In terms of upside potential, the likelihood that revenues could exceed even the highest levels experienced during the last farm income boom are 37% for corn (above $1,200 per acre) and 67% for soybeans (above $800 per acre) .
Source : illinois.edu