By Gary Schnitkey and Krista Swanson et.al
Department of Agricultural and Consumer Economics
University of Illinois
By Carl Zulauf
Department of Agricultural, Environmental and Development Economics
Ohio State University
Corn and soybean prices declined throughout much of the first half of 2020, with low prices persisting into early August. Since August, both corn and soybean prices have increased. Overall, commodity price movements have increased the relative profitability of soybeans to corn in 2020, continuing a string of years since 2013, in which soybeans have been more profitable than corn. Current budgets also suggest that soybeans will be more profitable than corn again in 2021.
2020 Harvest Time Future Prices
Prices on the December 2020 Chicago Mercantile Exchange (CME) corn contract and the November 2020 CME soybean contract are shown in Figure 1. From January 2018 to December 2019, the futures contract prices averaged $4.11 per bushel for corn and $9.53 per bushel for soybeans. From these 2018-2019 averages, prices declined slightly into February 2020. February is when settlement prices for the contracts are averaged to set projected prices for corn and soybean crop insurance policies in Midwest states. During February, the contract prices averaged $3.88 per bushel for corn and $9.17 per bushel for soybeans.
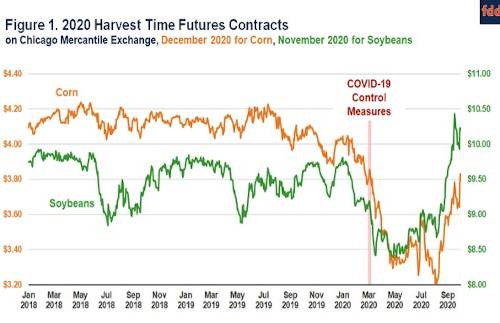
In March, concerns about coronavirus became pronounced, leading to the institution of COVID-19 control measures. Both corn and soybean prices began to decline. On August 7, prices were $3.21 per bushel for corn and $8.68 per bushel for soybeans. From February averages to the August 7, corn prices fell $.67 or -17%. Compared to corn, the relative decline was lower for soybeans at -5%.
Since August 7, both corn and soybeans have been generally on upward trajectories. During the week from September 28 to October 2, corn prices averaged $3.76 per bushel, an increase of $.55 per bushel from the August 7 price. Soybean prices averaged $10.15 per bushel during the week of September 28, an increase of $1.47 per bushel. Both corn and soybeans increased an average of 17% from August 7 to the first week of October.
Harvest-Time Soybean-to-Corn Price Ratios
Coronavirus control measures had a more substantial impact on corn than soybeans , resulting in corn prices decreasing more than soybean prices, as is illustrated by the soybean-to-corn price ratios shown in Figure 2. The soybean-to-corn price ratio equals the soybean price divided by corn price. Increasing soybean-to-corn price ratios indicate that soybean prices have increased relative to corn prices. As shown in Figure 2, the soybean-to-corn price ratio increased from February to August and has been relatively stable since August. In February, the soybean-to-corn price ratio was 2.34 ($9.17 soybean price / $3.88 corn price). From September 28 to October 3, the soybean-to-corn price ratio averaged 2.70 ($10.15 soybean price / $3.76 corn price).
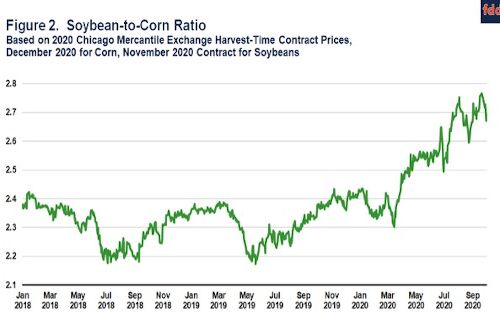
A 2.70 soybean-to-corn price ratio is above 2.62, the average 2013-2019 soybean-to-corn price ratio based on settlement prices of the CME futures contracts during October (see Figure 3). While the current ratio is above the 2013-2019 average, there were several recent years in which the soybean-to-corn price ratio was even higher than the current 2.70 ratio: 2.93 in 2013, 2.77 in 2013, 2.80 in 2016, and 2.79 in 2017.
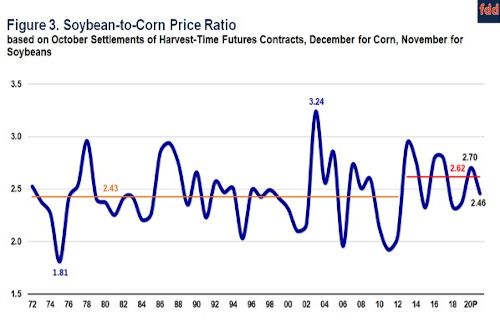
The average 2.62 price ratio during the 2013-2019 period is higher than the 2.43 average from 1972 to 2012. Corn use in producing ethanol increased from 2006 to 2013, with corn use in ethanol being stable since 2013 (see farmdoc daily, September 22, 2020). Since the growth in ethanol production reached a plateau, soybean prices have generally been higher relative to corn as compared to the 1972-2012 period.
Profitability Implications
Figure 4 shows corn-minus-soybean returns for farms enrolled in Illinois Farm Business Farm Management (FBFM) on high-productivity farmland in central Illinois. Before 2013, corn was more profitable than soybeans in most years. From 2013 onwards, soybeans have been more profitable than corn. Several factors contribute to this change in 2013, including exceptionally good soybean yields in many years. Soybean prices relative to corn prices have also played an important role in this shift in profitability.
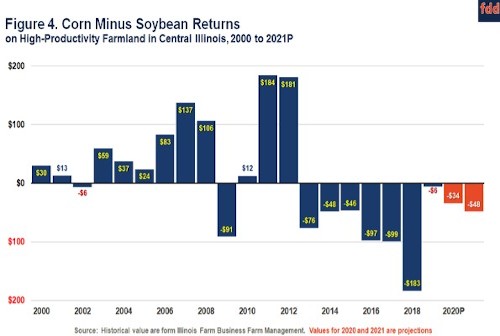
For 2020, soybeans again are projected to be more profitable than corn. On high-productivity farmland in central Illinois, operator and land returns are projected at $314 per acre for corn and $348 for soybeans , giving soybeans a $34 per acre advantage over corn. These 2020 projected returns include good yields for corn (230 bushels per acre) and soybeans (72 bushels per acre), and the second round of Coronavirus Food Assistance Program (CFAP) payments.
Our current projections suggest that soybean returns will exceed corn returns again in 2021 (see 2021 Crop Budgets), as has been the case since 2013. Recent events likely reinforce this situation where soybeans are more profitable than corn. COVID-19 control measures have reduced travel, leading to reductions in fuel and ethanol use, which depresses corn demand. Alternatively, soybean prices are supported by recent exports of soybeans to China that are strengthening demand for soybeans.
Source : illinois.edu