By Scott Irwin
Department of Agricultural and Consumer Economics
University of Illinois
The U.S. ethanol industry faced considerable headwinds in 2018, including the lowest prices over the last decade, policy setbacks in the implementation of the RFS, and political resistance to granting a year-round RVP waiver for E15. The impact of these headwinds on ethanol production profits is certainly of interest to those in the ethanol industry, as well as policymakers and legislators interested in the financial health of the U.S. renewable fuels industry. The purpose of this article is to estimate the profitability of U.S. ethanol production in 2018 using the same basic model of a representative Iowa ethanol plant that has been used in earlier farmdoc daily articles on the subject (e.g.,
January 6, 2016;
February 1, 2017;
March 14, 2018).
Analysis
As noted above, a model of a representative Iowa ethanol plant is used to track the profitability of ethanol production. The model is meant to be representative of an “average” ethanol plant constructed in the last decade. There is certainly substantial variation in capacity and production efficiency across the industry and this should be kept in mind when viewing profit estimates from the model. Some of the model assumptions include:
- Dry mill plant constructed in 2007
- 100 million gallon annual ethanol production capacity
- Plant construction costs of $2.11 per gallon of ethanol production capacity
- 40% debt and 60% equity financing
- 25% interest on 10-year loan for debt financing
- A total of $0.21 fixed costs per gallon of ethanol produced
- Non-corn, non-natural gas variable costs (including denaturant) of $0.21-$0.26 per gallon in 2007-2011
- Non-corn, non-natural gas variable costs excluding denaturant of $0.16 -$0.17 per gallon after 2011
- Variable denaturant costs after 2011 computed as 2 percent of wholesale CBOB price
- 30 cubic feet of natural gas per gallon of ethanol
- 80 gallons of ethanol (including denaturant) produced per bushel of corn processed
- 16 pounds of dried distillers grain (DDGS) produced per bushel of corn processed
- 55 pounds of corn oil per bushel of corn processed (starting in January 2012)
- Netback (marketing) costs of $0.05 per gallon of ethanol and $4 per ton of DDGS.
To track plant profitability over time, weekly ethanol and DDGS prices at
Iowa ethanol plants are collected starting in late January 2007. Crude corn oil prices for the Midwest are available from OPIS. Natural gas costs over 2007-2013 are estimated based on monthly industrial prices for Iowa available from the EIA. Since January 2014 the Iowa industrial price has only been reported sporadically, and when reported, has been out-of-line with its historical relationship to nearby natural gas futures prices. Consequently, a regression relationship between nearby natural gas futures prices and natural gas costs over 2007-2013 is used to estimate natural gas costs starting in January 2014.
Figure 1 presents the three components of plant revenue per gallon—ethanol, DDGS, and corn oil—on a weekly basis from January 26, 2007 through February 1, 2019. The chart shows that ethanol prices (net of netback marketing costs) started 2018 at historically low levels of $1.25 per gallon, rose to a peak of $1.43 in April, and then fell most of the rest of the year, reaching a low of $1.06 in late November. The November low was the lowest weekly price for ethanol in this time period. DDGS prices were a bright spot for the ethanol prices for most of 2018, with prices generally ranging from 1.1 to 1.3 times the price of ethanol. This was a major turnaround in DDGS prices from 2017. The rise in DDGS prices was not enough to lift total revenue in 2018 above 2017 levels. Total revenue in 2018 averaged $1.75 per gallon compared to $1.76 per gallon in 2017. Figure 2 shows the four major cost components for producing ethanol. The cost of corn is the major input cost, about 70 percent of variable and fixed costs on average, and since the price of corn was relatively stable again in 2018, average total variable costs for the year of $1.55 per gallon was only slight higher than in 2017.
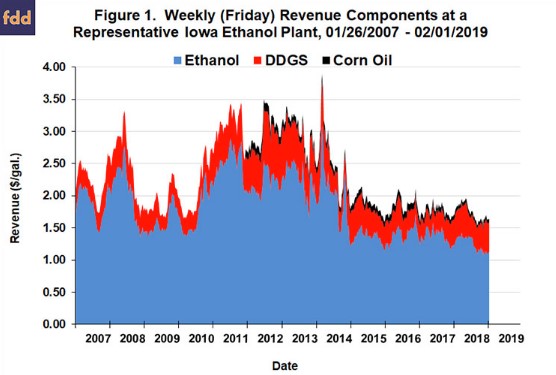
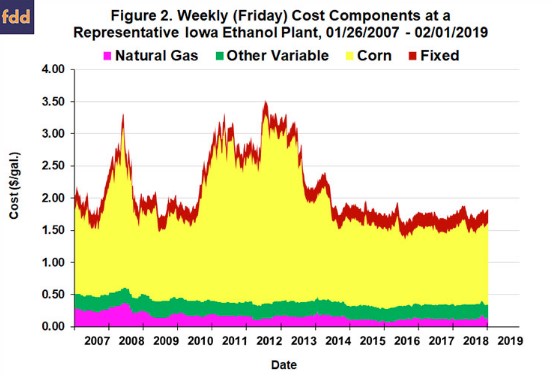
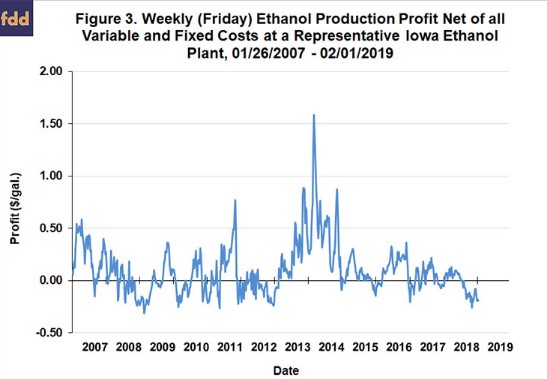
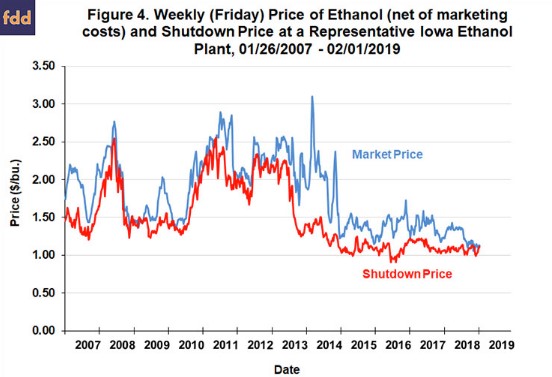
Figure 3 presents (pre-tax) estimates of ethanol production profits net of all variable and fixed costs. Net profits in 2018 averaged a loss of -$0.02 per gallon, compared to gains of $0.03 in 2017, $0.12 in 2016 and $0.07 in 2015. In reality, the pattern of net profits in 2018 was a tale of two periods. The average net profit from January through July was a respectable $0.05 per gallon. Mirroring the sharp decline in ethanol prices, returns from August through December averaged a loss of -$0.11 per gallon. Net profits turned negative in the second week of August 2018 and have remained so through the most recent week of available data. This is a run of 26 consecutive weeks of losses and counting. The depth of the losses experienced in the last five months of 2018 is highlighted in Figure 4, which shows the market price of ethanol at plants (net of marketing costs) and the shutdown price for the representative plant. The shutdown price equals variable costs minus non-ethanol revenue (DDGS and corn oil). The market price dipped below the shutdown price in late November 2018 for the first time since December 2012. The market price has remained very close to the shutdown price through early February 2019.
There is no mystery as to the cause of the steep ethanol production losses in 2018. As highlighted in the farmdoc daily article of
February 8, 2019, the U.S. ethanol industry was rocked by low prices in 2018, especially in the second half of the year when prices reached their lowest levels in over a decade. The real argument is the driving force behind the low prices. The ethanol industry has placed much of the blame for the low prices on small refinery exemptions (SREs) granted under the Renewable Fuel Standard (RFS) by the U.S. EPA. While there is no doubt that SREs have opened a backdoor mechanism for the EPA to reduce the statutory and obligated RFS volumes, the evidence shows that the physical use of ethanol has declined little if any during the last year (
September 13, 2018;
December 13, 2018;
January 16, 2019;
January 24, 2019;
January 31, 2019). Instead, the evidence points to overproduction as the most likely explanation for the low ethanol prices (farmdoc daily,
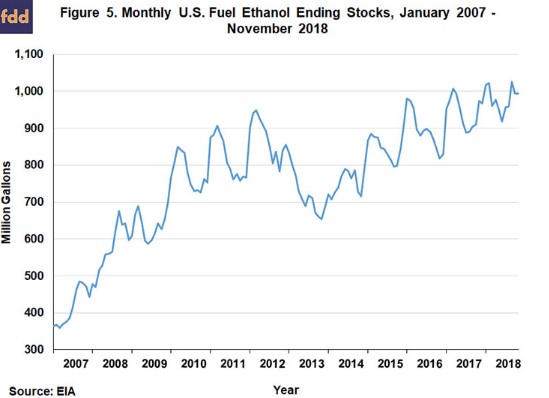
February 8, 2019). While domestic and export use for U.S. ethanol have increased since 2014, both production capacity and actual production have increased even faster. For example, ethanol production in the U.S. looks to have topped 16 billion gallons for the first time in 2018 and this has simply been too much for the domestic and export fuel markets to absorb. The result is that ethanol stocks have risen sharply (Figure 5) and this has led to declining ethanol prices and profits.
Additional perspective on ethanol production profitability is provided in Figure 6, where the profit margins are aggregated over an annual horizon for 2007-2018. Profits are presented in terms of both total pre-tax net returns and percent return to equity. The 2018 net loss of -$2.2 million was the first annual loss since 2012 and only the fourth annual loss over 2007-2018. With the loss, the total cumulative (pre-tax) return to equity holders for the 2007-2018 period stands at $122.0 million, slightly less than the assumed equity investment for the representative plant of $126.6 million. We can use the average net loss for the representative plant to make a rough estimate of profit for the entire U.S. ethanol industry in 2018. Assuming all plants in the industry earned a net loss of -$0.02 per gallon and that total ethanol production for the U.S. was 16.1 billion gallons in 2018, aggregate ethanol industry (pre-tax) losses can be estimated at -$354 million.
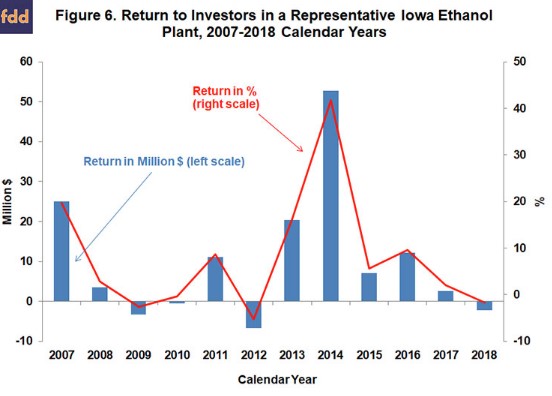
Finally, the percent return to equity holders provides useful information on the attractiveness of investment in ethanol plants relative to other investments. The average return was 8.3 percent over 2007-2018 and the standard deviation, a measure of risk, was 13.0 percent. By comparison, the average return for the stock market over this period,
as measured by the S&P 500, was 8.7 percent and the associated standard deviation was 17.7 percent. The ratio of average return to standard deviation provides one measuring stick of an investment’s return-risk attractiveness, and on this measure the ratio for ethanol investment, 0.62, continues to compare favorably with the ratio for the stock market as a whole, 0.49. This provides important context when considering the losses experienced by ethanol producers in 2018. Even with this loss included in the data, ethanol plants have a more than respectable record of investment performance over the last dozen years.
Implications
The ethanol industry in 2018 experienced its first losing year since 2012, thereby ending a run of five consecutive years of positive returns. The estimated loss for a representative Iowa ethanol plant in 2018 was -$2.2 million. While large, the 2018 loss was still far less than the -$6.7 million loss in 2012. The evidence points to overproduction as the driving force behind the low prices and financial losses experienced by ethanol producers during 2018. The fortunes of the U.S. ethanol industry are unlikely to improve until production and use are better balanced. This will require shuttering some production capacity, additional demand, or some combination of the two. The most optimistic scenario is additional demand for U.S. ethanol exports as part of a trade deal with China.