The
Coronavirus Aid, Relief, and Economic Security Act provided $9.5 billion in funding (approximately 0.48% of a package totaling nearly $2 trillion) to the Office of the USDA Secretary to craft a financial support package for producers impacted by COVID-19-driven supply, demand and revenue disruptions, i.e.,
What’s in the CARES Act for Food and Agriculture. Combining existing Commodity Credit Corporation funding of $6.5 billion with the $9.5 billion appropriated, the secretary created a $16 billion Coronavirus Food Assistance Program to provide direct payments to farmers and ranchers to partially offset COVID-19-related losses for livestock, dairy, specialty crop and non-specialty crop producers, i.e.,
Reviewing Coronavirus Food Assistance Program Details.
USDA
data reveals that as of the end of June nearly one-third, or $4.85 billion, of the $16 billion in CFAP assistance has been paid to livestock, dairy, crop and specialty crop producers. Of that total, $2.4 billion, more than 50%, has been paid to livestock (cattle, hog and lamb producers), $1.3 billion, or 26%, has been paid to non-specialty crop producers, $1 billion, or 22%, has been paid to dairy producers and $113 million, or 2%, has been paid to specialty crop producers.
CFAP Payments by State
Of the nearly $4.9 billion in CFAP payments made to agricultural producers, a majority of the assistance went to producers in the Midwest. Iowa leads the nation with more than $500 million in CFAP support, followed by Nebraska at $345 million, Michigan at $324 million and Minnesota at $310 million. Ten states have received $2.9 billion, or nearly 60% of total CFAP payments made to date. Figure 1 highlights total CFAP payments by state through June 29.
CFAP Payments for Livestock
Through the first four weeks of CFAP payments, livestock producers have received $2.4 billion, or more than 50% of total payments. Payments to livestock producers are currently the highest in the Midwest and across portions of the Southwest, where cattle feeding and hog operations are concentrated. Iowa currently leads the nation in livestock payments at $251 million, followed by Nebraska at $202 million, Texas at $185 million, Kansas at $181 million and South Dakota at $179 million. Figure 2 highlights total CFAP payments to livestock through June 29.
While the total CFAP payments are concentrated in the Midwest and Southwest, the average CFAP payment per application is currently the highest in Western states at $22,000 per application in Nevada, followed by $21,000 per application in California. The average payment across the U.S. is $10,206 per application. Figure 3 highlights average CFAP payments per livestock application.
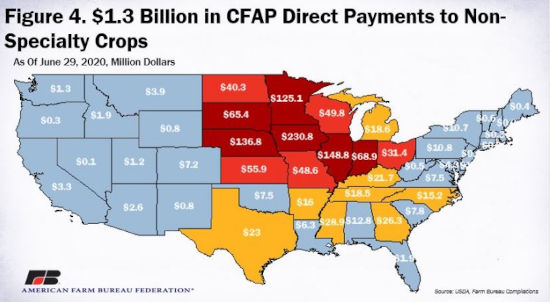
CFAP Payments for Non-Specialty Crops
Non-specialty crop producers have received $1.3 billion, or 26%, of the $4.9 billion in CFAP payments made through June 29. Payments to non-specialty crop producers, e.g., corn, soybeans, cotton and wheat, are highest in the Midwest (
Reviewing the CFAP Payment Formula for Non-Specialty Crops), with Iowa leading the nation at $231 million, followed by Illinois at $149 million, Nebraska at $137 million and Indiana at $69 million. Figure 4 highlights total CFAP payments to non-specialty crop producers through June 29.
While total CFAP payments are highest in the Midwest, the average CFAP payment per application is currently the highest in several Southeastern states and Arizona. Mississippi has an average CFAP payment of $22,000 per application, followed by Arizona at $16,000. Georgia, Alabama, Louisiana and South Carolina all have average CFAP payments of more than $10,000 per application. The average payment across the U.S. is $7,189 per application. Figure 5 highlights average CFAP payments per crop application.
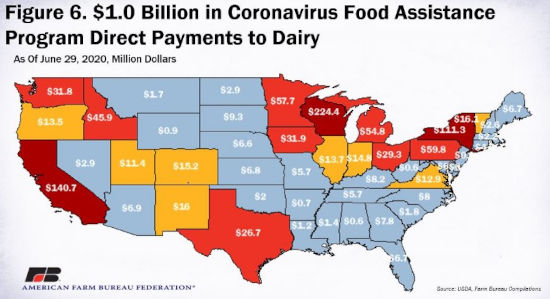
CFAP Payments for Dairy Farmers
The most recent CFAP payment report reveals that dairy producers have received slightly more than $1 billion, or 22% of total CFAP direct payments. Payments to dairy producers align with the traditional milksheds, with Wisconsin the highest at $224 million, followed by California at $141 million. New York has the third-highest CFAP support for dairy farmers at $111 million. Many Southeastern states have received less than $10 million in CFAP dairy support. Figure 6 highlights total CFAP payments to dairy farmers through June 29.
Compared to livestock, non-specialty crop and specialty crop producers, the average CFAP payment of $59,250 per dairy producer application is significantly higher. CFAP payments per application for dairy producers are currently the highest in Western states, where dairy operations tend to be the largest. New Mexico has an average CFAP payment of $250,000, followed by Nevada at $202,000 and Arizona at $202,000. Wisconsin, the nation’s second-largest milk producing state currently has an average CFAP payment of $79,000 per application.
Click here to see more...