Subsidies for crop insurance are being debated as the farm bill begins to come into focus. Subsides related to premium support for farmers have raised concerns in the past. Recent proposals have suggested an increase in premium support targeted at higher-risk farmland. Herein we provide background on premium support and an analysis of the impacts of a recently proposed 4% cap on farmer-paid premiums as a share of liability. The design of crop insurance already provides higher per-acre support to higher-risk areas and providing more support is highly questionable from a policy perspective.
Federal Subsidies for Crop Insurance
Crop insurance is a Federally subsidized program. Many farmers would not buy crop insurance without subsidies, particularly in lower-risk areas like the Midwest. By providing subsidies, more farmers use crop insurance as a risk management tool. Encouraging widespread use of crop insurance is seen as a way to move away from ad hoc disaster assistance programs, which have undesirable characteristics. Ad hoc disaster assistance is never known until Congress enacts it, hence the name ad hoc. It thus cannot be built into risk management plans, reducing their benefits to farmers and lenders. Crop insurance use has become widespread, and ad hoc disaster spending was relatively low from 2002 to 2017, averaging $2.3 billion per year compared with over $11 billion per year (both in real $2023) from 1998 to 2001. In recent years, however, ad hoc programs have re-emerged in the form of the Wildfire and Hurricane Program (WHIP), WHIP+, and Economic Recovery Program (ERP) (see farmdoc Daily, June 6, 2022, June 7,2022, and June 14, 2022). Payments from the Market Facilitation and Pandemic Assistance programs since 2018 also represent significant levels of support through disaster assistance designs.
The Risk Management Agency (RMA) administers the Federal crop insurance program and sets its premiums. When setting “total” premiums, RMA is instructed in legislations to develop premiums such that the U.S. program is actuarially sound, meaning that total premiums should equal crop insurance payments over time. Over time, loss ratios from Federal crop insurance — insurance payments divided by total premium — should average 1.0, or slightly below. The 1.0 target differs from commercial, non-subsidized products, where loss ratios between .50 and .67 are more typical. Lower target loss ratios are needed to provide for loss reserves when payments are larger than normal, to cover administrative costs, and to generate profit for the risk bearing involved.
Federal support for Federal crop insurance comes in three primary forms:
- Premium support: Farmers only pay a portion of the “total” premium set by RMA, with the remainder provided by the Federal government. The Federal government portion often is called the risk subsidy.
- Administrative and Operating (A&O) subsidies: Crop insurance is provided through private crop insurance companies. The (A&O) subsidy provides funding for crop insurance companies to cover costs, with A&O ranging from 12.0% to 21.9% of total premium (CRS, Federal Crop Insurance, Delivery Subsidies in Brief).
- Reinsurance gains or losses: The private companies have a standard Reinsurance Agreement (SRA) with the Federal government through Standard Reinsurance Agreement (SRA). Through the SRA, the Federal government backstops loss for private insurance companies. The SRA also allows companies to put policies in differing risk-sharing pools, and companies tend to put the highest-risk policies in a pool where the Federal government bears most of the risk.
Premium Support
By a large margin, premium support is the largest Federal outlay associated with crop insurance. During farm bill discussions, a common suggestion is to limit premium support to provide funds for other priorities. For example, a recent Governmental Accounting Office report suggests limiting the total amount of premium support to a farming operation (GAO-23-106228). During previous farm bills, similar discussions have occurred.
Premium support is calculated using subsidy rates set by Congressional action. These subsidy rates are permanent in the sense that they will stay the same until Congress again changes the statutory rates. Subsidy rates vary by coverage level and by unit, as is illustrated in Table 1, which shows rates for products that insure farm-level yields and revenue. Subsidy rates decrease with higher coverage levels, meaning that farmers pay more of the premium at higher coverage levels. For basic and optional units, subsidy rates are 100% at a Catastrophic (CAT) level, meaning that farmers do not pay premiums (there are administrative fees). CAT coverage is at a 50% coverage level with lower possible payments than at a 50% level. Subsidy rates decline to 38% at an 85% coverage level.
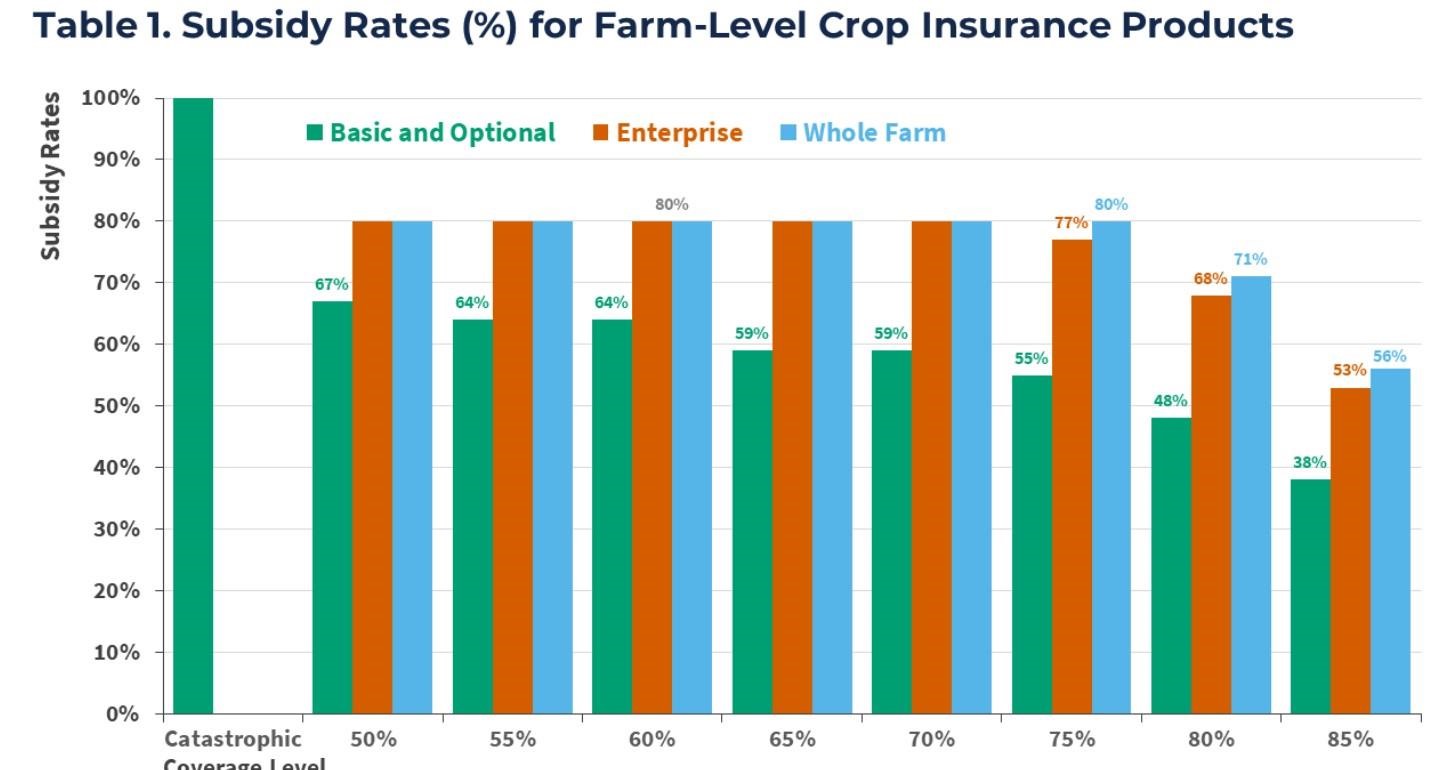
Subsidy rates vary by unit:
- Optional Unit (OU): Each surveyed crop section is insured separately. Of the units, the total premium is the highest for this unit, as optional units typically have has the lowest number of acres. In general, reducing acres within an insured unit increase the risk of loss.
- Basic Unit (BU): Insurance is by the farmer’s share of production, not by land section. Premiums are lower than for optional units as high production on one section can offset a loss on another section.
- Enterprise Unit (EU): All sections and shares planted to a crop in a county are combined. Including all land planted to a crop in an entire county results in an even lower risk of overall loss for the insurance unit. Thus, premium rates on enterprise units are lower than for basic units. A Multi-County Enterprise Unit is also available for farms that cover more than one county. Premium rates are lower for enterprise units than for basic units because the likelihood of payment is also lower.
- Whole Farm Unit (WU): All insurable acres of all insured crops planted in a county can be combined into one unit. Since more than one crop is combined in a whole farm unit, the potential for indemnity payments is reduced due to offsetting changes in the production of different crops. Whole farm unit is not the same as Whole Farm Revenue Protection (WFRP) insurance (see farmdoc Daily, June 12, 2023).
The current basic and optional unit subsidy rates were set in the Agricultural Risk Protection Act of 200. ARPA increased subsidies, lowering the out-of-pocket costs for the farmer which resulted in higher participation in crop insurance. Higher subsidies for enterprise and whole farm units were instituted in the 2008 Farm Bill, aiming to encourage enterprise unit use as ways to manage risk across the crop at a lower cost to the producer. Enterprise units also reduce the record-keeping and validation concerns with optional and basic units. The use of enterprise units increased after the 2008 Farm Bill was implemented.
Premium Support Examples
Table 2 shows 2023 premiums for corn in three counties in different states, thereby illustrating the impact of subsidies. Premiums are shown for Revenue Protection (RP), the most used product. Premiums are given for optional and enterprise units. Basic unit premiums will be between optional and enterprise units. Each county is a large production county in their respective states. The counties are:
- McLean County, Illinois. Illinois is the second largest corn-producing state in the U.S. and is the largest-producing county in Illinois. Illinois is a low-risk state, with large crop insurance losses typically restricted to drought years. Rates in McLean County are representative of the high-producing areas in Illinois, Iowa and the Midwest generally.
- Richland County, North Dakota. Corn production has grown in North Dakota. North Dakota risks are higher than in McLean County, with prevent plant being a significantly higher risk than in McLean County, Illinois. Rates in Richland County are representative of the upper Midwest.
- Sherman County, Texas, is in the panhandle, a large agricultural area where corn and cotton production has grown over time. Drought is a large concern, and the rates in Table 2 are for irrigated corn. Rates in Texas are representative of the dryer regions of the southern and central Great Plains.
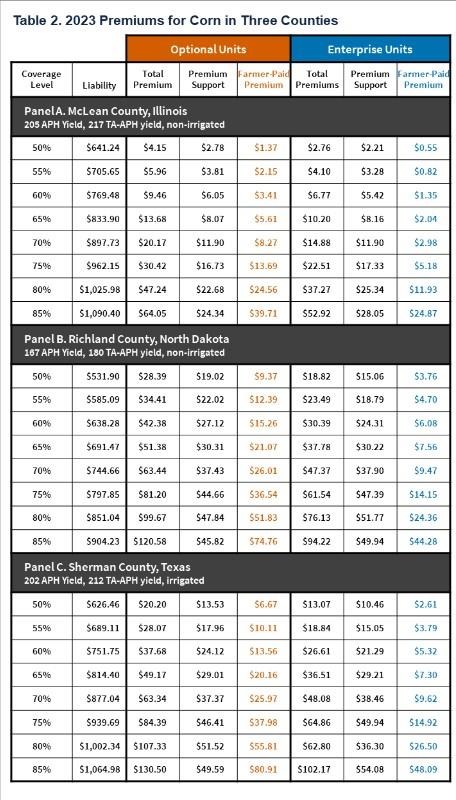
The first column of Table 2 shows the liability for each product. Liability represents a measure of potential losses from a product. In Table 2, liability equals trend-adjusted Actual Production History (APH) yield times projected price times coverage level. Liability is directly related to expected production. Given the same guaranteed yields, liability would not vary across units.
Total premiums are the lowest for McLean County, the lowest yield risk county of the three. For an optional unit, the total premium at the 85% coverage level is $64.05 per acre. Total premiums in the $60 level are reached by the 70% coverage levels in Richland County, North Dakota ($63.44 per acre) and Sherman County, Texas ($63.34 per acre). The higher premiums in these two countries reflect the increased riskiness of production in these counties and thus the increased likelihood of insurance indemnity payments.
Because total premiums are lower, premium support on a dollar/acre basis is also lower for McLean County, Illinois. At an optional unit level, premium support ranges from $2.78 per acre at the 50% coverage level to $24.34 at the 85% coverage level for McLean County. Premium support on a dollar /acre basis is much higher in both North Dakota and Texas. At a 75% coverage level, premium support is $46.41 in Sherman County, 2.77 times higher than the $16.73 in McLean County, Illinois. At a 75% coverage level, similarly, Richland County, ND premium support is $44.61 per acre, or 2.77 times higher than the $16.73 in McLean County, Illinois. Because of the different risks of production in the respective counties, farmers purchasing the same coverage level (75%) receive far more in federal premium support in Richland County, ND and Sherman County, TX.
To summarize, the relationship between the various insurance variables goes as follows:
- Higher production risk leads to higher expected indemnity payments,
- Higher indemnity payments lead to higher total premium,
- Higher total premium leads to higher premium subsidy, which is a Federal outlay.
Higher premium subsidies can encourage the production of higher-risk crops in higher-risk areas. During the past twenty years, corn and soybean production has grown in Richland County, North Dakota, while corn and cotton production has grown in Sherman County, Texas. Many factors have influenced this growth, including the introduction of ethanol and continued growth in soybean exports. Higher subsidies to crop insurance did not hinder this growth.
Capping Farmer-paid Premium at 4%
Recently, Bullock and Steinbach introduced the idea of a 4% cap on farmer-paid premiums as a percent of liability (farmdoc Daily, June 5, 2023). Under this proposal, the total premium would stay the same, and premium support would increase to cover a larger share of the total premium, reducing farmer-paid premiums in areas of higher risk, particularly at higher coverage levels.
The cost of this proposal was estimated at $186 million based on an analysis of enterprise units for Actual Production History (APH), Revenue Protection (RP), RP with harvest price exclusion (RPHPE), and Yield Protection (RP) products, using data contained in the Summary of Business for 2022 (farmdoc Daily, June 5, 2023). If this proposal is introduced in farm bill discussion, an offset would need to be found in some other farm bill program. Moreover, the $186 million could underestimate the Federal outlays of the program for three reasons:
- Summary of Business data gives summed results for a “bin” of policies that are for the same state, county, crop, plan, coverage level, type, and practice. Within that bin, farmer paid premium divided by liability will vary across policies. In a bin that has an average higher than 4%, there will be some policies that do not meet the threshold. In these cases, the amount of additional premium support is over-estimated. In counties with below a 4% average, there will be some policies above the 4% limit. These policies will tend to be the higher risk farms, and the amount of additional premium is under-estimated. Because additional premium is over-estimated in some cases and under-estimated in other cases, we cannot say the direction of the bias for certain. Our judgement is that the proposal will under-estimate additional premium support because there are many more bins that average below the 4% limit — 78% bins average under the limit compared to 22% over the policy –- giving many more chances of under-estimation.
- The estimates do not include changes in crop insurance purchase behavior. Using history as a guide, changes in subsidy will change behavior. We would expect more purchases of crop insurance policies that increase in premium support.
- The analysis was limited to enterprise units for specific products. The paper did not make clear whether this was an enterprise only proposal or whether the analysis was limited to enterprise units. As will be shown in the next section, an inclusion of all units would increase purchases of optional units away from enterprise units. The analysis also was conducted for a limited set of units and crops. Other products and commodities would likely desire a 4% limit.
We provide an analysis of regions using the above three case farms, and then discuss within county impacts
Regional Impacts of the Proposal
To illustrate regional impacts, Table 3 shows farmer-paid premiums as a percent of liability for the three counties in Table 2. In McLean County, Illinois, farmer-paid premium does not exceed 4%. The highest level is 3.64% for optional units at the 85% coverage level. Thus, the proposed 4% cap would not impact the average policy in McLean County, Illinois.
A 4% cap, however, would have an impact at the enterprise unit level on both Richland County, North Dakota and Sherman County, Texas. The 85% farmer-paid premium in Richland County would be reduced to $36.91, down by $12.75 from $44.66. To remain actuarially fair, the Federal premium subsidy would need to increase by a corresponding dollar amount. Thus, the $12.75 decrease at the 85% level would increase premium support by $12.75 per acre. In Sherman County, the 85% enterprise unit level would be reduced to $42.59, a reduction of $1.68 from $44.28.
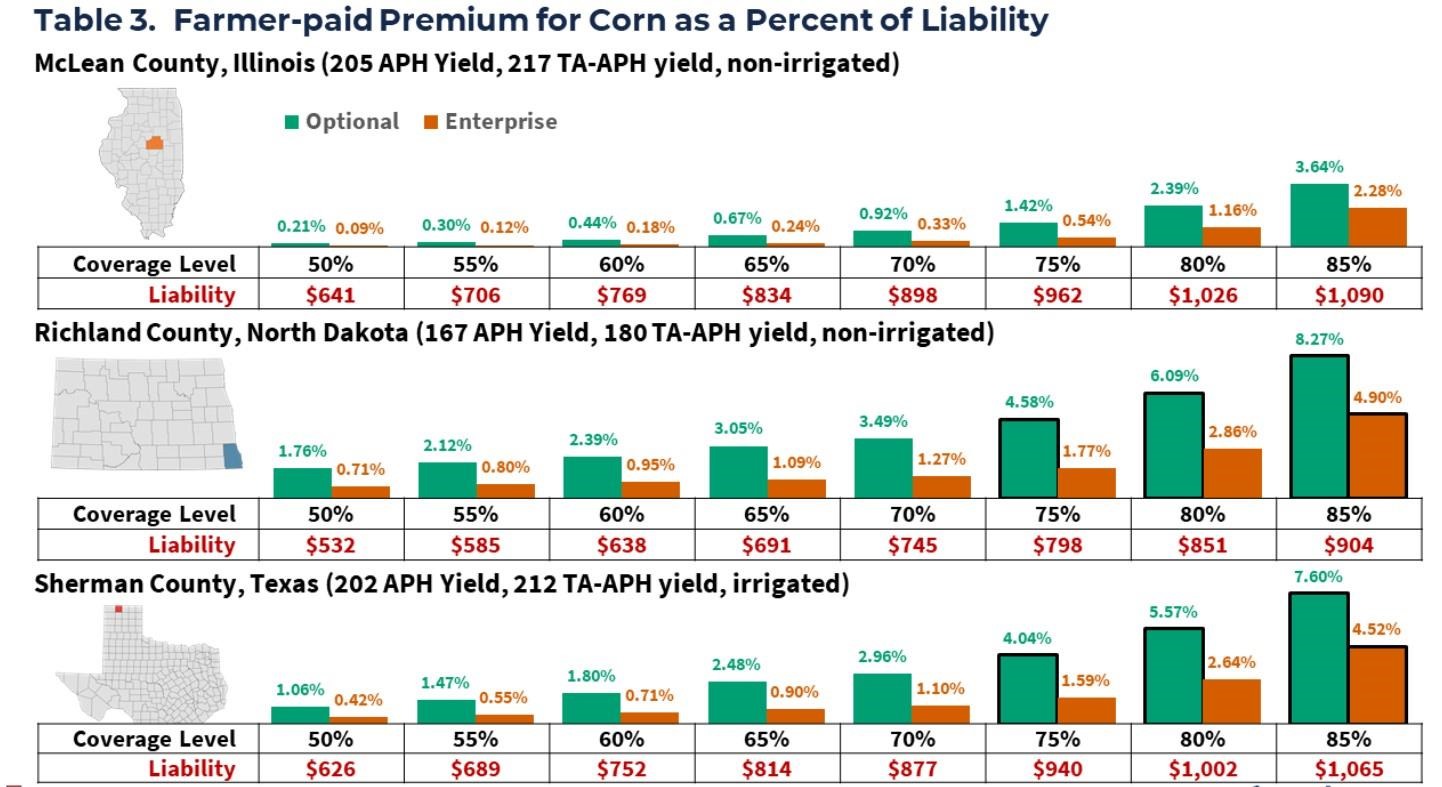
If it were allowed, a 4% cap would have a much larger impact on optional unit premium. For optional units in Richland County, North Dakota, farmer-paid premiums exceed 4% at 75% and higher coverage levels. If adopted, the 4% premium rate cap would result in farmer-paid premium for optional units by coverage level as shown below:
- 75%: $31.94, down $12.75 from $44.66,
- 80%: $34.04, down $13.80 from $47.84, and
- 85%: $36.17, down $9.65 from $45.13.
When the cap is exceeded for both optimal and enterprise units, the farmer-paid premiums for enterprise and optional units would be the same. In the Richland County case, enterprise and optional units would both have a $36.17 farmer-paid premium. When faced with this situation, farmers would likely switch from enterprise to optional units, as there is a higher chance of payment with optional units.
Within County Impacts
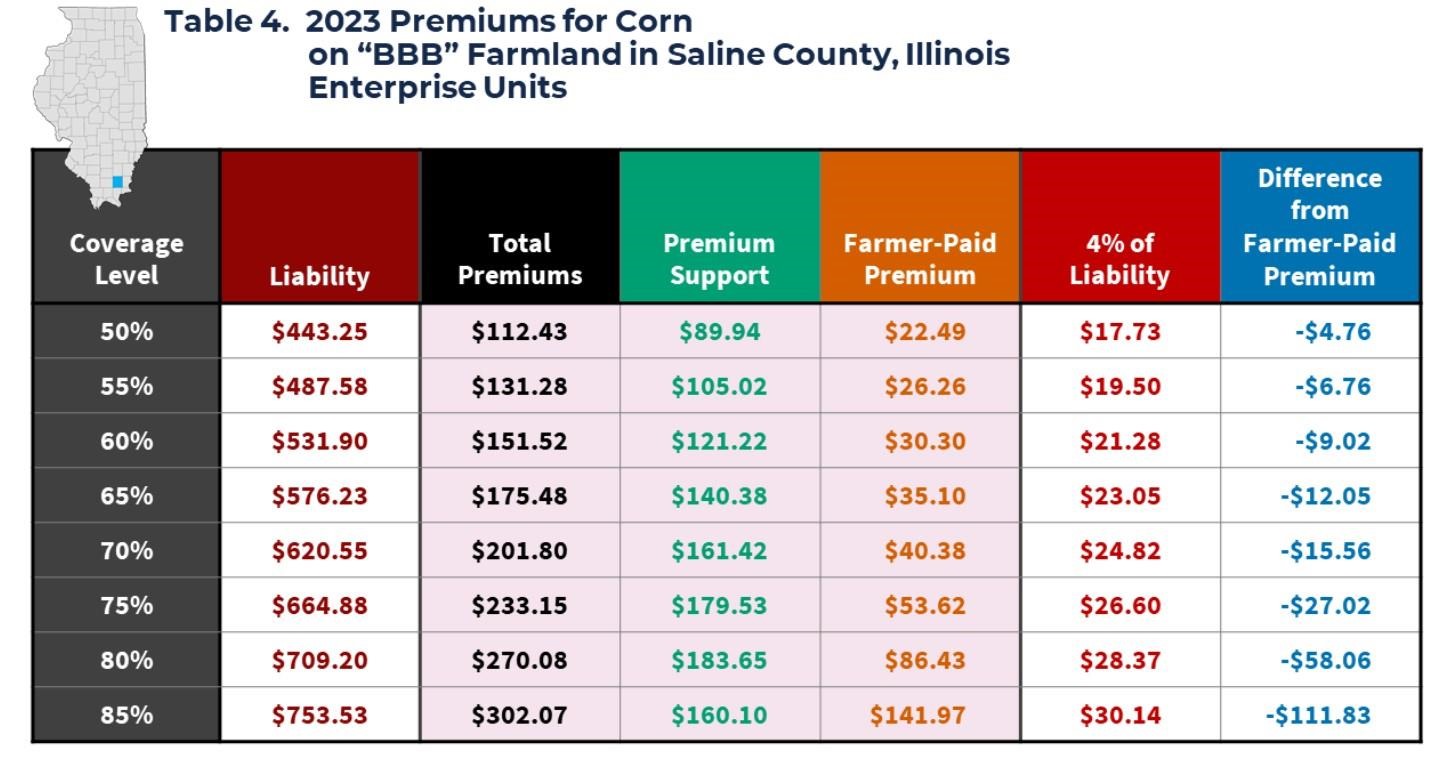
There is the potential for some policies to exceed the 4% threshold even in counties with average farmer-paid premium as a percent of liability below 4%. These policies will have higher risks. Some of those polices will have substitute t-yields for actual yields in their guarantee. “High risk” farmland also will have the potential to have farmer paid premiums above 4% of liability.
“High-risk” farmland often is prone to flood, and often have prevent plant claims. Premiums for high-risk land are much higher, reflecting the increased likelihood of claim, and this proposal would lower those premiums. Table 4 provides an example of high-risk premiums in Saline County, Illinois. This “BBB” farmland is a class of high-risk farmland. Farmer-paid premiums of over $302.07 per acre at an 85% coverage level. A 4% cap would cause the farmer-paid premium to decline by $111.83 per acre to $30.14 per acre. The reduced 85% premium is near the current $22.49 premium for the 50% coverage level. Farmers would increase their coverage levels, increasing the costs to the taxpayer, and increasing the risks born by crop insurance companies and the Federal government.
Concluding Comments
As currently designed, premium support provides higher per-acre subsidy amounts to higher-risk areas. A 4% cap on farmer-paid premiums would further increase, in some cases dramatically increase, support for higher-risk areas.
The incentive to produce more in higher risk area would increase. Is this good policy? Is this good expenditure of taxpayer dollars? Why should farmers in high-risk areas receive more premium support than farmers in lower-risk areas? Within an area, why would high risk farmland receive more premium support than lower risk area. Premium support has raised public-policy concerns in the past. Desirability of providing more support for higher-risk areas and farmland is questionable.
Source : illinois.edu