By Scott Irwin
Department of Agricultural and Consumer Economics
University of Illinois
The operational efficiency of any industry is key to long-term profitability, no less so for the U.S. ethanol industry. Surprisingly little information is available in the public domain on this important aspect of ethanol production in the U.S. Fortunately, the USDA began publishing the Grain Crushings and Co-Products Production report in October 2014 and we now have enough observations from this important data source to examine trends in some key industry efficiency measures, including gallons of ethanol per bushel of corn, pounds of dried distillers grain (DDGS) per bushel of corn, and pounds of corn oil per bushel of corn. The purpose of this article is to compute these measures at the aggregate level for the U.S. ethanol industry and to examine trends in the measures over time. We also are interested whether the industry’s response to the coronavirus pandemic in 2020 altered any pre-existing trends in operational efficiency.
Analysis
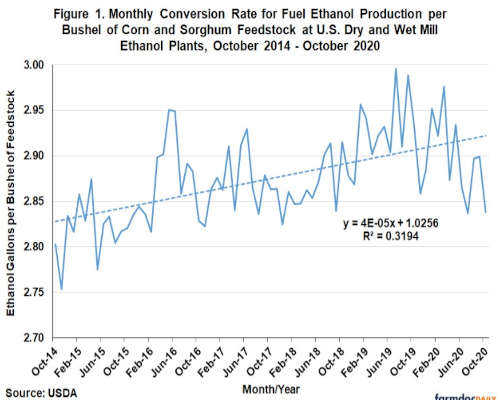
The first operational efficiency measure that we compute is the gallons of ethanol produced per bushel of feedstock processed. We compute this measure by dividing monthly fuel ethanol production from the EIA by the bushels of corn and sorghum feedstock used at U.S. dry and wet mill ethanol plants from the USDA’s Grain Crushings and Co-Products Production report. Both corn and sorghum feedstock are included in the denominator because fuel ethanol production does not distinguish between feedstock used to make the ethanol. Figure 1 shows the resulting aggregate monthly conversion rate for ethanol per bushel of corn and sorghum feedstock from October 2014 through October 2020, the latest month for which data is available. There is a clear upward trend over time, with the ethanol conversion rate steadily increasing from around 2.80 in late 2014 to a peak near 3.00 in mid-2019. This represents a about a 9 percent total increase in efficiency, or a gain of roughly 1.8 percent per year. It is interesting to observe the modest reversal of this trend during the coronavirus pandemic. After peaking at 2.98 in March 2020, the ethanol conversion rate declined to 2.84 in October 2020.
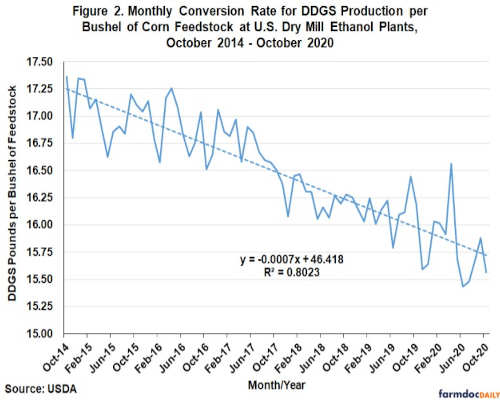
The second operational efficiency measure is the pounds of DDGS produced per bushel of corn processed. Computing the pounds of DDGS produced is complicated by the different types of distillers grains that are produced by dry mill ethanol plants. We focus on dry mill plants in order to avoid the additional complication of aggregating corn germ and gluten meal from wet mill ethanol plants with by-product from dry mill plants. The Grain Crushings and Co-Products Production report lists five categories of distillers grain co-products for dry mill plants, so assumptions are needed in order to aggregate the different categories on a dry matter equivalent basis. We assume that condensed distillers solubles and distillers dried grains are components of DDGS so we simply sum these two categories without adjustment and add them to DDGS production. We then adjust distillers wet grains with 65 percent or more moisture and modified distillers wet grains with 40 to 65 percent moisture to an equivalent dry matter for DDGS. Since DDGS has 10 percent moisture as a standard, we multiply the quantity of distillers wet grains with 65 percent or more moisture by 0.45 =1–(0.65-0.10) and modified distillers wet grains with 40 to 65 percent moister by 0.7 = 1–(0.40-0.10). We use conservative assumptions for moisture content in order to avoid under-estimating DDGS production on a dry matter equivalent basis.
Figure 2 shows the resulting aggregate monthly conversion rate for DDGS per bushel of corn feedstock from dry mill ethanol plants over October 2014 through October 2020. Just the opposite of ethanol conversion rates, there is a clear downward trend in DDGS conversion rates over time. The DDGS rate starts at 17.34 pounds per bushel of corn in October 2014 and then declines systematically throughout the sample period, ending at 15.56 pounds in October 2020. This represents a 1.78 pound drop in DDGS production per bushel of corn, or a 10.3 percent decline. Notice that the linear trend regression shown in Figure 2 explains slightly more than 80 percent of the variation in the DDGS conversion rate. It is also interesting to observe that the coronavirus pandemic did very little to interrupt this downward trend. The only notable exception was the spike to a conversion rate of 16.56 pounds in April 2020, which was completely reversed in the next two months.
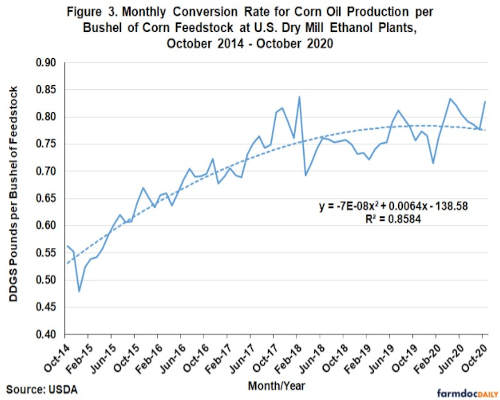
The third measure of operational efficiency is the pounds of corn oil produced per bushel of corn processed. This is straightforward to compute as both components are reported directly in the Grain Crushings and Co-Products Production report. This measure of operational efficiency shows a non-linear trend over the sample period, with a period of very rapid growth from late 2014 through early 2018 and much more modest growth thereafter. From the trough in December 2014 to the peak in February 2018 the corn oil conversion rate increased from 0.48 to 0.84 pounds per bushel of corn processed, or an increase of 75 percent.
The picture that emerges from this analysis is one of tradeoffs in operational efficiency. Ethanol producers have clearly increased ethanol and corn oil conversion rates at the expense of DDGS conversion rates. Presumably, this was a rational response to the available technology for increasing production efficiency and the economic incentives for production of ethanol and corn oil versus DDGS.
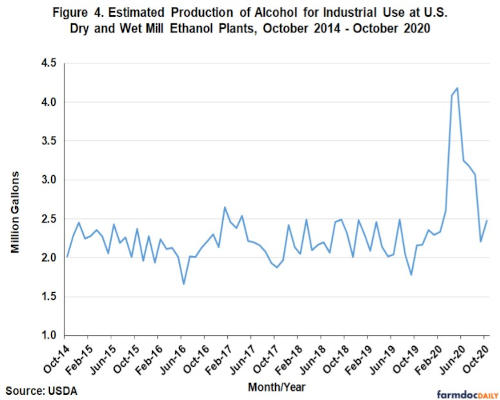
The only evidence of a direct impact on operational efficiency from the coronavirus pandemic is in ethanol conversion rates. Part of the answer may be the switch of some plants to producing ethanol for use in hand sanitizers during the early part of the pandemic. Figure 4 provides an estimate of the production of alcohol for industrial use at dry and wet mill ethanol plants over October 2014 through October 2020. We assumed the conversion rate for industrial ethanol production was the same as that for fuel ethanol found in Figure 1. There is a clear spike in industrial production at ethanol plants from March through August 2020, which can explain at least some of the drop in the fuel ethanol conversion rate during the pandemic.
Implications
Recent trends in the operational efficiency of the U.S. ethanol industry are analyzed in this article. There is a clear upward trend over time in ethanol conversion rates, which steadily increased from around 2.80 gallons per bushel of corn and sorghum in late 2014 to a peak near 3.00 in mid-2019. This represents about a 9 percent total increase in efficiency, or a gain of roughly 1.8 percent per year. The rate declined moderately during the coronavirus pandemic. Just the opposite of ethanol conversion rates, there is a clear downward trend in DDGS conversion rates over time. The DDGS rate starts around 17.25 pounds per bushel of corn in 2014 and then declines systematically throughout the sample period, ending at about 15.50 pounds in 2020. The most rapid gain in operational efficiency is associated with the corn oil conversion rate, which increased from about 0.45 pounds per bushel in 2014 to around 0.85 pounds in 2018, a gain of 75 percent. The overall picture is one of tradeoffs in operational efficiency. Ethanol producers have clearly increased ethanol and corn oil conversion rates at the expense of DDGS conversion rates. Presumably, this was a rational response to the available technology for increasing production efficiency and the economic incentives for production of ethanol and corn oil versus DDGS.
Source : illinois.edu