By Gary Schnitkey and Jim Baltz et.al
Department of Agricultural and Consumer Economics
University of Illinois
Carl Zulauf
Department of Agricultural, Environmental and Development Economics
Ohio State University
The Risk Management Agency (RMA) recently realized 2021 county yields, thereby allowing payments to be made on area plans of insurance, including Supplemental Coverage Option (SCO) and Enhanced Coverage Option (ECO). With those payments made, we assess the overall loss performance of Federal crop insurance for 2021. Overall, loss payments relative to total premiums were low across the U.S. Loss payments were particularly low in Illinois and the Midwest because corn and soybeans had few payments.
Overall U.S. and Illinois Crop Insurance Performance
Loss ratios are used to judge crop insurance performance. A loss ratio equals indemnity payments on crop insurance divided by the total premiums paid for crop insurance. Total premiums include those paid by farmers and risk support provided by the Federal government. A loss ratio of 1.0 means that crop insurance payments equal total premium. Loss ratios above 1.0 mean that payments exceed premiums and vice versa. When it sets premiums, the Risk Management Agency (RMA) aims to maintain a loss ratio slightly less than 1.0, thereby building loss reserve in ratings. Currently, the Congressional Budget Office uses a .80 loss ratio when it projects crop insurance outlays into the future.
For the U.S., the overall crop insurance program loss ratio in 2021 was .68, below the 1.0 breakeven point (see Figure 1). In the last ten years, the loss ratio has exceeded the 1.0 benchmark only in three years: 1.57 in 2012, 1.02 in 2013, and 1.05 in 2019. The 2021 loss ratio of .68 was below the ten-year average from 2012 to 2021 of .84 and the five-year average from 2017 to 2021 of .77. RMA began reporting loss ratios in its Summary of Business in 1989. From 1989 to 2021, the loss ratio averaged .93. In 2021 and recent years, loss ratios have been low.
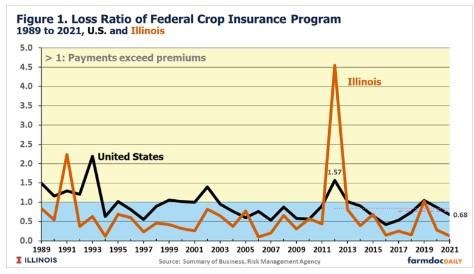
Illinois had an exceptionally low loss ratio in 2021 of .13 (see Figure 1). The 2021 loss ratio of .13 is the lowest since 2006, when Illinois had an average loss ratio of .10. During the last ten years, Illinois’ loss ratio has been an average of .84. The .84 average includes the 2012 drought year when Illinois’ loss ratio averaged 4.55. In the last five years, the loss ratio has averaged .37. Few insurable losses have occurred in the previous five years. The last five years include 2019, when a large amount of prevented planting occurred. The loss ratio in 2019 was 1.09, not particularly large given the significant issues with prevented planting. From 1989 to 2021, the loss ratio in Illinois averaged .64, below the U.S. average of .93.
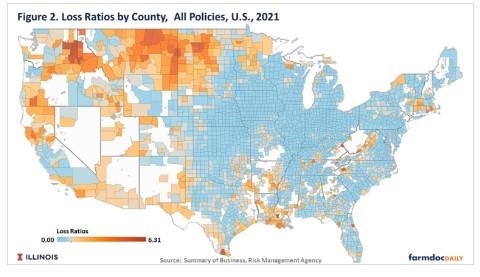
Iowa and much of the eastern Corn Belt also have low loss ratios for 2021 (see Figure 2). Areas that had loss ratios over 1.0, indicating losses exceeded premium, extended from Montana through parts of North Dakota, South Dakota, and Minnesota. Drought caused yield difficulties in the upper Great Plans.
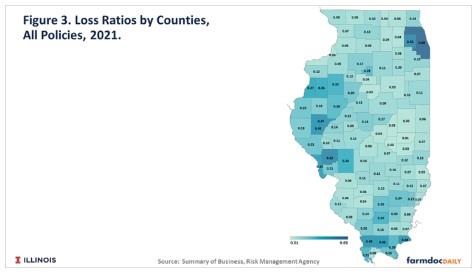
In Illinois, county loss ratios ranged from .01 to .69 (see Figure 3). The five counties with the highest loss ratios were Cook (.69), DuPage (.53), Greene (.52), Hardin (.49), and Union (.48) counties. The five counties with the lowest ratios were Douglas (.01), Moultrie (.02), Piatt (.03), and Champaign (.03), and Coles counties.
Corn and Soybean Performance
Illinois and Midwest’s low loss performance had much to do with low losses from corn and soybeans. Two reasons contribute to low losses:
- Harvest prices were above projected prices. Most farmers purchase Revenue Protection (RP) for insuring corn and soybeans (see Table 1 in farmdoc daily, January 25, 2022). RP is revenue insurance with a guarantee increase. When harvest prices are above projected prices, insurance payments predominately are due to yield losses. In the Midwest states, corn’s 2022 harvest price was $5.37, well above the $4.58 projected price. Similarly, soybean’s harvest price of $12.30 was well above the $11.87 projected price.
- Yields were at or above trend across much of the Midwest, resulting in few yield claims.
As a result, loss ratios were low for corn and soybeans, particularly in Illinois. The loss ratio for corn was .37 for the U.S. and .12 for Illinois (see Table 1). The 2021 loss ratio for U.S. corn of .37 was well below the five-year average of .60 and a ten-year average of .88. Illinois’ loss ratio for corn was .12 in 2021 was well below the five-year average of .36. and a ten-year average of 1.03.
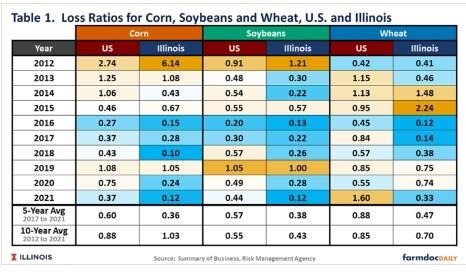
The U.S. loss ratio for soybeans in 2021 was .44, well below the .57 five-year average and .55 ten-year average. Illinois has had lower losses than the U.S. Illinois had a .12 loss ratio in 2021, below the .38 five-year average and .42 ten-year average.
By way of comparison, corn and soybean losses in 2021 were less than wheat. In 2021, the 1.60 loss ratio for wheat was above the 1.0 benchmark and well above corn and soybeans’ loss ratios. Again, the drought in the northern Great Plains contributed to higher losses.
Summary
Prices increased for both corn and soybeans in 2021. Moreover, yields were mostly above trend for corn and soybeans across much of the Midwest. As a result, Federal payments on crop insurance were relatively low in 2021. Crop payments were particularly low in Illinois and the Midwest.
Source : illinois.edu