By Joe Janzen
Department of Agricultural and Consumer Economics
University of Illinois
A recent farmdoc daily article (June 2, 2021) considered whether new-crop corn futures price behavior in the pre-harvest period is consistent with the presence of a growing season weather risk premium. The basic idea for a weather risk premium is that concerns about production declines due to negative weather events like drought create higher prices today than would be the case with “normal” weather and average production. If the growing season progresses without a major weather event, new-crop futures prices are expected to decline prior to harvest. That article showed price behavior since the year 2000 consistent with a small, but economically significant weather risk premium in new-crop corn futures prices. This seasonal corn futures price premium peaks around early June.
In this follow-up article, I consider whether past price data are consistent with a weather risk premium in new-crop soybean futures prices. In the US, soybeans are grown on roughly the same seasonal calendar and in roughly similar geography so they are subject to much the same weather as corn. In contrast to corn, I show that new-crop soybean futures prices are not on average substantially higher during the growing season than at harvest. Between 2000 and 2020, November soybean futures prices were on average neither higher or lower than the price at harvest.
At their seasonal maximum in mid-July, new-crop soybean futures are on average just 4% higher than in the week of November 1. This is inconsistent with the presence of a weather risk premium. One possible explanation for a weather risk premium in corn but not soybeans is the importance of South American production to the global soybean market, which dampens seasonal variation in soybean prices and reduces the importance of weather shocks in US Midwest to global soybean market fundamentals relative to corn.
What Is a Risk Premium?
In commodity pricing, a risk premium refers to the difference between the expected price of a futures contract at delivery and the current futures price. This price difference may be interpreted a form of compensation, or premium, to one side of the market for taking on the risk that prices will differ from expectations between now and contract expiration. One form of risk premium comes from specific event-related risks like weather. In the case of crop commodities, the market is often concerned about the risk that poor weather during the growing season may cause production shortfalls. If a negative weather event occurs, much higher prices may be necessary to ration scarce supply, especially when existing inventories are not available to buffer the price impact of lower production. The futures market may compensate those willing to sell ahead of harvest in the form of a risk premium.
Proving the existence of a weather risk premium is difficult. Risk premia are defined relative to expected prices, in this case the expected price of a futures contract at or near expiration. This expected price represents the collective ‘best guess’ of market participants about expected supply and demand conditions at harvest time and it is inherently unobservable. Since one cannot directly observe the weather risk premium, this article considers whether pre-harvest new-crop futures prices higher on average than the prevailing price at harvest. Such positive bias is consistent with the presence of a weather risk premium, particularly if the bias is larger during the June-August growing season and negligible once weather uncertainty related to crop yields is mostly resolved.
If a weather risk premium exists, it has direct implications for farmer marketing decisions. A weather risk premium implies that observed pre-harvest futures prices are biased upward, so that farmers will receive higher prices on average over the long run by pre-harvest hedging using futures sales relative to selling in the spot market at harvest. This does not mean farmers will always be better off. In some years, weather events will lead to higher prices at harvest time than in the pre-harvest period.
Analysis of Pre-harvest New-crop Futures Prices
To ascertain whether new-crop soybean futures prices are consistent with the presence of a weather risk premium, I consider prices for the new-crop November futures contract each year. I calculate the difference between the weekly average price of the November contract and the price at the conclusion of harvest just before the November contract expires. (This is the 44th week of the calendar year which contains November 1). These differences or deviations are calculated as a percentage of the price in week of November 1 to enable comparisons across years. For example in 2020, I compare average prices for the November 2020 futures contract over the period from November 5, 2019 to November 3, 2020 (which ranged from $8.43 to $10.80/bu) to the average price of that contract in the week of October 28 to November 3 (which was $10.55/bu).
Positive deviations between new-crop futures prices earlier in the pre-harvest marketing period and the new-crop futures prices at harvest are consistent with the presence of a weather risk premium. For this deviation to equal the risk premium defined above, one must assume the observed price near expiration is an unbiased estimate of the expected price discussed above.
Figure 1 plots weekly price deviations from the harvest-time price for each year from 2000 to 2020 by shading each week prior to the week of December 1 by how much the new-crop futures price was above or below the prevailing price at harvest. Green bars indicate prices above the harvest time price, magenta bars indicate prices below the harvest time price.
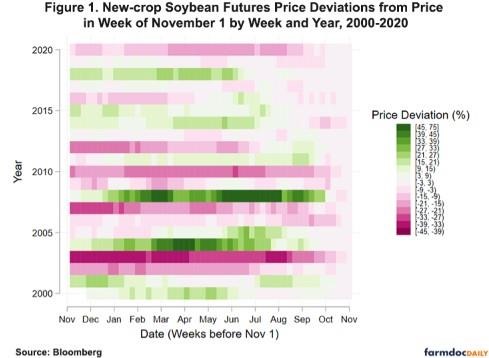
Figure 1 shows that pre-harvest new-crop soybean futures prices may be substantially above or below the price at harvest. In contrast to new-crop corn futures, price deviations show little tendency to be positive or negative. There are as many years with higher prices before harvest as years with lower prices before harvest. (i.e., there are as many “green” years as magenta ones.) Within a pre-harvest period, soybean prices show a stronger tendency to fluctuate both above and below the eventual harvest-time price. (i.e., there may be both “green” and “magenta” weeks within a given marketing year. These tendencies argue against the presence of a weather risk premium for soybeans.
Positive deviations, consistent with a weather risk premium resolved by average or good growing conditions, do appear in years following years of high prices and low crop inventories such as 2004 and 2008. In such years, the risk that a negative weather event leads to higher prices is substantial since inventories are unavailable to buffer production shortfalls. When such risks fail to materialize, prices fall between June and September. Positive deviations also appear in years like 2018, when new-crop futures prices fell after the initiation of the US-China trade conflict, and thus cannot not always be attributed to weather-related events.
Figure 2 summarizes the information in figure 1 by plotting the average percentage deviation and the range of deviations across years by week. The average deviation from the harvest time new crop futures price (shown by the dark blue line in figure 2) is near zero for all weeks of the pre-harvest marketing period. New-crop futures prices are on average below the harvest time price in the winter and early spring and rise to a seasonal maximum in mid-July. Prices in mid-July were on average 4% higher than the price at harvest. This seasonal maximum is later and smaller than in new-crop corn futures where prices reach an average seasonal maximum of 12% above the harvest-time price in early June. After peaking in mid-July, the average price deviation declines to near zero by early-September.
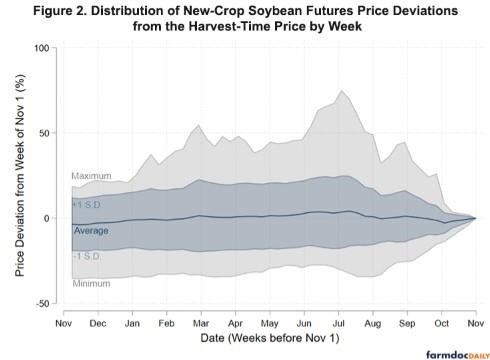
While new-crop soybean futures prices are on average only slightly above or below the harvest time price, the range of historical deviations is large. The shaded gray range shows the minimum and maximum deviation by week; prices have been anywhere from 75% higher to 35% lower than the harvest time futures price. The maximum 75% deviation occurred in July of 2008. Inspection of Figure 1 shows that such a large, positive growing-season price deviation is an outlier during this period. This outlier year is one major reason why the average deviation exceeds zero during the growing season.
The shaded blue range in Figure 2 plots values one standard deviation above and below the mean value given by the solid line. It shows that approximately two-thirds of the time prices are between 20% above and 20% below the harvest time futures price during the period from March to August. Deviations from the harvest time price are substantially smaller after September.
Figure 2 implies that selling November soybean futures ahead of harvest will not be especially profitable in the long run, especially if one accounts for the risk inherent in such a position. For farmers are who long new-crop soybeans by virtue of the crop they have planted, there is price risk related to the November soybean futures prices without taking any futures position. The results in figure 2 suggest farmers may earn a slight premium in the long-run by selling soybeans pre-harvest with this premium being largest in mid-July. Hedging with the sale of November futures is one way to capture this premium. Forward sales using hedge-to-arrive contracts are another. However, the benefits of such forward sales for soybeans in the last 21 years have been smaller than for corn.
Why the Difference between Corn and Soybeans?
Past price behavior in new-crop futures prices is consistent with the presence of a weather risk premium in corn but not soybeans, even though both crops are grown in roughly similar locations in the United States and face roughly the same weather conditions. One explanation is the relative importance of US corn production to global supply and trade compared to soybeans. Compared to other major exporting countries for each commodity, the US produces more relatively more corn than soybeans. In the 2020/21 marketing year, US corn production was about 360 million metric tons (mmt). Countries classified as “major exporters” of corn in the USDA World Agricultural Supply and Demand Estimates produced 206 mmt. In the same year, US soybean production was approximately 113 mmt, while other major exporters produced 196 mmt.
Differences in production location and harvest timing between corn and soybeans are one possible explanation for the differences in the behavior of new-crop futures prices during the US growing season. South America, mainly Brazil and Argentina, produces most of the soybean involved in export trade outside of the US. Those soybeans are harvested during the US winter and spring. The availability of South American soybean production, especially late in the US growing season, may mitigate the effect of weather shocks in the US Midwest on price, so that soybean buyers in the US futures market do not need to pay a premium for new-crop soybeans produced in the US.
Source : illinois.edu