By Carl Zulauf
Department of Agricultural, Environmental and Development Economics
Ohio State University
This article examines the changing distribution of world corn production since 2000. Data are from the US Department of Agriculture, Foreign Agriculture Service’s Production, Supply, and Distribution data base. This article is a companion to the farmdoc daily articles of November 4 and November 16, 2020. They, respectively, examined China’s aggregate grain and oilseed sector and China’s corn sector. The later article lifted up the importance of comparing the 2000-04 and 2017-20 periods for China. To maintain consistency with that article, the same two periods are used in this article.
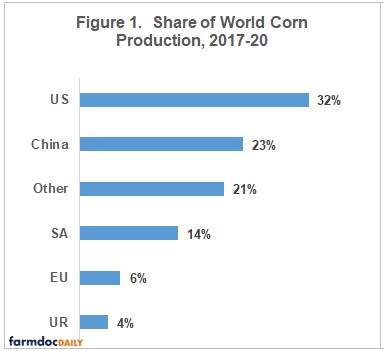
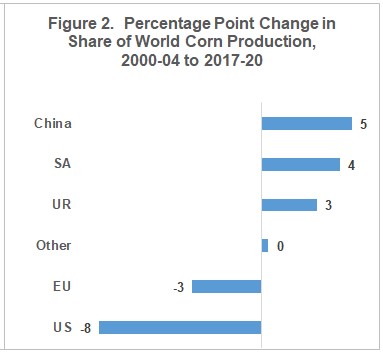
World Production Share: The US produced 32% of the world’s corn during the 2017-20 crop years (see Figure 1). Its share was 8 percentage points less than during 2000-04 (see Figure 2) when it was approximately 40% (32 + 8). World share also declined for the European Union (EU). Share increased for China, the world’s second largest corn producer; South America (SA) and Ukraine-Russia (UR) by 3 to 5 percentage points.
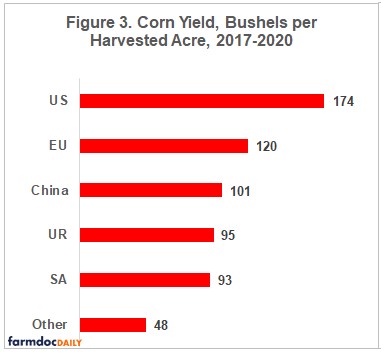
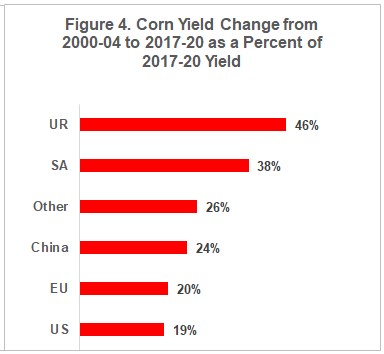
Yield: US corn yield of 174 bushels per harvested acre is nearly 55 bushels above the next highest (120, European Union) and over 3 times higher than the lowest (48, other country category) (see Figure 3). Smallest percent increase in corn yield since 2000 was in the US (see Figure 4). While half or less of the percent increase for Ukraine-Russia and South America, it does not differ much from the percent increase in the European Union, China, and other country category.
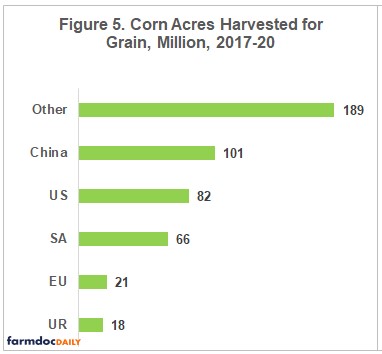
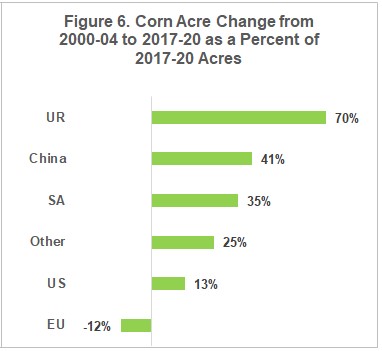
Acres: Forty percent of world corn acres are in countries in the other category (see Figure 5). Ukraine-Russia has the fewest acres but, by far, the largest percent increase since 2000 (see Figure 6). China passed the US in number of acres as it had the second largest percent increase. The US had the smallest percent increase, but acres declined in the European Union.
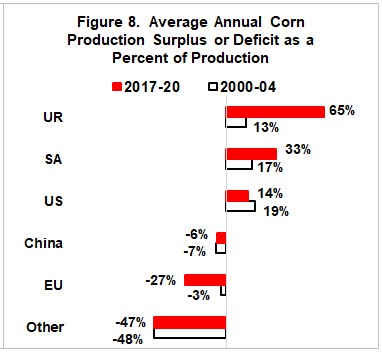
Production Surplus / Deficit: All 6 areas had a larger average annual difference between production and domestic consumption of corn in 2017-20 than 2000-04 (see Figure 7). This implies an increasing role for international trade of corn. No area flipped between a surplus and deficit. Three areas had a 1 billion bushel plus increase in either their production deficit (other countries) or production surplus (Ukraine-Russia and South America). But, what really stands out is the large increase in the European Union’s deficit and the surpluses in Ukraine-Russia and South America when expressed as a share of their production (see Figure 8). Emergence of Ukraine-Russia and expansion in South America were critical to meeting the world’s expanding demand for corn. While the US is tied with South America for the largest production surplus, the US surplus as a share of production declined.
Concluding Observations
Since the turn of the 21st century, the distribution of corn production among the 6 world areas examined in this study has changed notably, with the US role declining.
The role of acres and yield in the changing distribution of world corn production varies by region. A decline in acres in the European Union is the main reason for its declining share. Increasing acres is the primary reason for China’s increasing share. Both increasing yield and acres are important in the growing role of Ukraine-Russia and South America.
The US role declined as it had the smallest percent increase in both yield and acres, excluding the decline in acres in the European Union. The smallest percent increase in yield is not surprising since the US has the highest average yield by a considerable amount. The role of acres bears watching as total US principal crop acres has not changed in this Century. Nevertheless, the US remains the world’s largest producer of corn.
Most of the US’s attention is directed toward South America and increasingly Ukraine-Russia, but the role of China as a producer of corn needs to be added to the must watch list. It is the world’s second largest producer with an increasing demand for corn. As discussed in the November 4 and 16, 2020 farmdoc daily articles, China could be on the verge of becoming a consistent importer of corn.
This analysis underscores the little discussed critical role of other countries as a collective group. Their annual collective production deficit has grown by nearly 2 billion bushels since 2000. Their increasing deficit likely results from increased consumption of meat and livestock products. On the other hand, this group of countries appears to have the potential for much larger yield growth.
With the growth in corn used for ethanol slowing in the US, concern has arisen about where demand will come from for the continuing rise in US yields from already high levels. This analysis suggests a potential answer is exports to most of the rest of the world, not just China. Realization of this potential depends in part on US field crop agriculture and corn in particular being willing to shift its focus to developing and upgrading its role in international trade.
Source : illinois.edu