By Scott Irwin and Todd Hubbs
Department of Agricultural and Consumer Economics
University of Illinois
One of the key early assessments of the U.S. average corn yield is the projection made by the USDA’s World Agricultural Outlook Board (WAOB). Since 1993, those projections have been used in the May, June, and July WASDE reports to make supply, ending stocks, and price projections for the upcoming marketing year. While it is clear that the WAOB yield forecasts are perceived by market participants as containing important new information, these forecasts appear to be poorly understood by many and often confused with later forecasts released by the National Agricultural Statistics Service (NASS) of the USDA. The purpose of today’s article is to describe the crop weather model that the WAOB uses to make corn yield forecasts and demonstrate specifically how the 2020 forecasts were generated.
Analysis
To begin, it is important to understand that WAOB and NASS corn yield forecasts are based on entirely different procedures. WAOB forecasts of national corn yield are “model-based” and released as part of the May, June, and July WASDE reports each year. From 1993-2012, the WAOB forecasts were based on relatively simple trend analysis of historical yields, sometimes modified by planting progress (
farmdoc daily, April 30, 2015). Since 2013, WAOB corn yield forecasts have been based on a crop weather model as described in Westcott and Jewison (2013). NASS forecasts of state and national corn yield are based on large scale farmer surveys and field measurement surveys. These forecasts are released in monthly crop production reports from August through November each year, with the final yield estimates released in January after harvest. The NASS corn yield forecasts are released simultaneously with WASDE reports and the forecasts are used without adjustment in WASDE supply projections.
With that background, we can turn our attention to describing the crop weather model used to generate WAOB corn yield forecasts. As detailed in Westcott and Jewison (2013), the WAOB crop weather model is a “Thompson-style” regression model. Specifically, the model of U.S. average corn yield was originally estimated using data for 1988 through 2012 and included the following explanatory variables: i) a time trend variable to represent technological change, ii) corn planting progress as of May 15th, iii) June precipitation shortfall, iv) July precipitation, v) July average temperature. The planting progress and weather data were collected for eight key corn-producing States (Iowa, Illinois, Indiana, Ohio, Missouri, Minnesota, South Dakota, and Nebraska). These eight states typically ranked in the top 10 corn-producing states when the model was originally developed. An aggregate measure for the eight states was constructed using harvested corn acres to weight state-specific observations.
The mid-May planting progress variable was based on data in the weekly
Crop Progress report from the USDA and is interpolated to May 15th using adjacent weeks in years when planting progress was not reported for that specific date. Since extreme weather deviations from normal in June can have large impacts, as seen in 2012 and in 1988, the model uses a measure of the June precipitation shortfall from average in years when June precipitation is in the lowest 10-percent tail of its historical distribution. Since much of corn reproduction occurs in July, both temperature and precipitation from that month were included in the model.
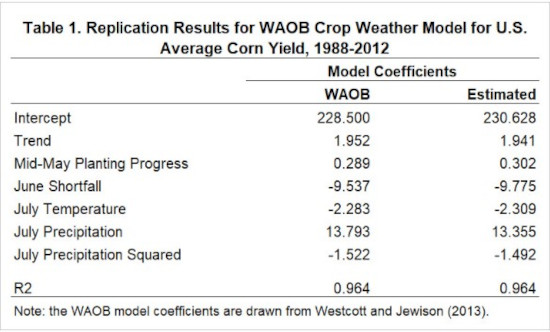
We collected yield, planting progress, and weather data for 1988-2019 following as closely as possible the definitions discussed above. We then computed acreage-weighted “Corn Belt” aggregates of the planting progress and weather variables. Finally, we estimated the model using linear regression over 1988-2012 in an attempt to replicate the original model results found in Table 6 of Westcott and Jewison (2013). Our estimated results are compared to the original estimates provided by Westcott and Jewison in Table 1. We were unable to replicate exactly the original estimates but were able to come very close. The differences are fairly trivial and probably reflect small differences between the data sets used in the two regression estimations.
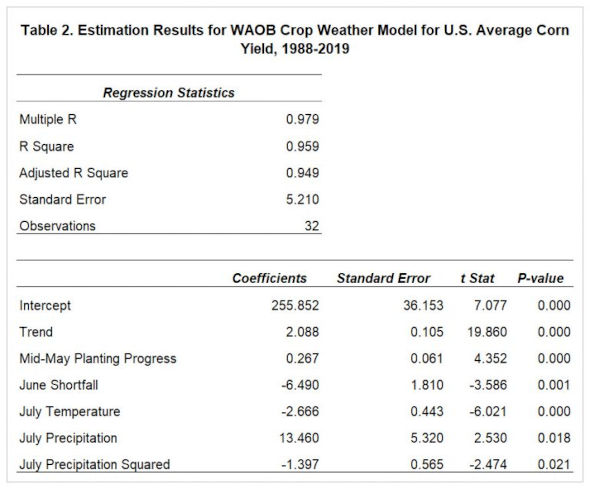
The next step was to update the crop weather model estimates through 2019. These estimation results are shown in Table 2. The estimates for 1988-2019 differ little from those over 1988-2012 shown in Table 1, with the exception of the June shortfall variable. The coefficient estimates shown in Table 2 are presumably close to those used by the WAOB to generate the yield projection of 178.5 bushels per acre released in the
May 2020 WASDE report. We now turn to the task of replicating this yield forecast using the estimation results shown in Table 2.
It would seem straightforward to estimate a 2020 corn yield using the WAOB crop weather model. Simply take the coefficient variables found in Table 2 times the sample averages for each variable, sum the results, and generate the projection. Note that in the case of the June shortfall variable, the sample average is not literally zero but this value is typically assumed unless a severe drought like 1988 or 2012 is expected. This procedure generates the following 2020 yield forecast:
The computed forecast is indeed very close the published WASDE forecast in May and June of this year of 178.5 bushels. However, it is close to the published WASDE forecast for the wrong reasons.
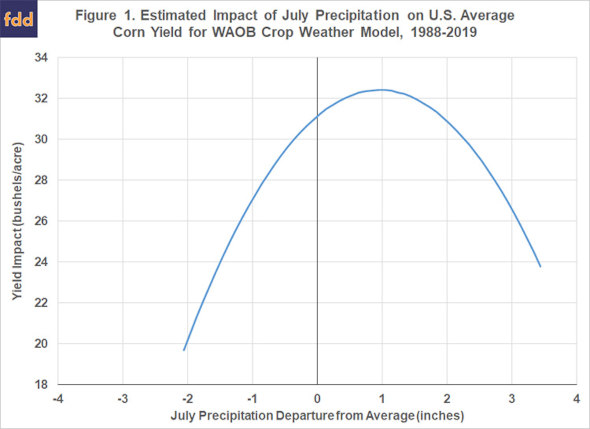
The first reason the above projection is wrong is that the WAOB uses a 10-year average for mid-May planting progress. We also assume that 2019 is omitted from this calculation because it was such an outlier. The second reason is more complex. The July precipitation variable is specified as a non-linear quadratic function. Figure 1 plots this estimated relationship using the coefficients presented in Table 2. For convenience, the x-axis is expressed in deviations from the sample average for July precipitation. The estimated “hill-shaped” relationship has the important property that the response to July precipitation is asymmetrical. That is, large deviations below average reduce yield more than large deviations above average increase yield. This is the reason that one cannot plug average July precipitation into the model when making forecasts. The yield impact of average July precipitation, zero in Figure 1, is not the average of all the yield outcomes plotted in the figure. The true average lies somewhere to the left of the zero line because poor July weather reduces yield more than good July weather helps yield.
There are various methods to account for the non-linear impact of July precipitation when making yield projections with the crop weather model. One is to use Monte Carlo simulation, which is what we did last week in a different application of crop weather models (
farmdoc daily,
June 25, 2020). The WAOB instead determines the one-standard deviation range of July precipitation above and below the average, computes the yield prediction for all levels of July precipitation within this range, and then averages the resulting yield predictions. Westcott and Jewison (2013) indicate this procedure reduced the 2013 model yield projection by 0.65 bushels per acre.
We attempted to follow the WAOB non-linear adjustment for July precipitation as closely as possible. We did this by ranking July precipitation from low to high, determining the cutoffs for one-standard deviation above and below the average July precipitation, computing model predictions for each observation of July precipitation between the cutoffs, and then averaging all the resulting predictions. The revised computation for the 2020 corn yield is shown below:
Using these revised procedures we are able to successfully replicate the published WASDE corn yield forecast released in May and June of this year. In addition to this exercise, we shared our computations with the WAOB and they confirmed that they use similar procedures to the ones we employed.
Implications
Corn yield forecasts contained in May, June, and July WASDE reports from the USDA provide important information to market participants. The forecasts are based on a crop weather model maintained by the World Agricultural Outlook Board (WAOB). The model and procedures used by the WAOB to generate forecasts from the model appear to be poorly understood by many and often confused with later survey-based forecasts released by the National Agricultural Statistics Service (NASS) of the USDA. The WAOB crop weather model for corn is actually fairly simple, with trend, planting progress, and four weather variables. We collected the same yield, planting progress, and weather variables as listed in a 2013 report that first presented the WAOB model. Our model estimates using this data were very close to the original estimates found in that report. We then went on to update the model estimates through 2019 and project the 2020 national average yield for corn. After adjusting for the non-linear response of corn yield to July precipitation, we were able to exactly replicate the published forecast of 178.5 bushels per acre. Hopefully, this exercise will increase understanding of the WAOB crop weather model and procedures used to generate these important and market-moving corn yield forecasts.
Source : illinois.edu