By Joe Janzen
On Friday August 12, the USDA released its latest World Agricultural Supply and Demand Estimates, or WASDE. The WASDE report provides an updated point of reference for agricultural commodity price expectations. This article discusses adjustments made by USDA to its new-crop US corn and soybean balance sheets and one thing to watch going forward: news about corn and soybean demand and use.
As expected, USDA made substantive changes to the production side of the balance sheet. Based on new data from the National Agricultural Statistics Service (NASS), both acreage and yield estimates were updated in the August report. These changes lowered corn production estimates and raised soybean production estimates. More modest changes were made to domestic use and exports for both crops. The net result of these changes was a slight decline in the projected ending-stocks-to-use ratio for corn to 9.6% and a slight increase for soybeans to 5.4%. Both levels are historically below average.
Market reaction to the report in Friday’s futures market trade was mixed. New-crop futures prices for both corn and soybeans fell immediately after the report release but rebounded quickly and ended the day near the previous day’s closing price. While US production news related to weather and crop conditions will continue to be an important price driver at least through the summer, there is some demand uncertainty that remains unaddressed by current WASDE projections for corn and soybean use. Changes in both domestic use and exports seem likely, with new-crop prices at historically high levels, gasoline use below long-run norms, and sluggish export sales all factors. However, as this article shows, year-over-year changes to the use side of the balance sheet, especially for domestic use, tend to be smaller than year-over-year changes to production.
Current USDA New-crop Supply and Demand Estimates
Table 1 shows changes in the new-crop 2022/23 US balance sheets for corn and soybeans between the July and August WASDE reports. For corn, projected US production for 2022 is decreased by 146 million bushels. This is the result of declines in both the harvested acres and yield estimates. Due to late planting progress, NASS resurveyed and updated planted acreage estimates in some state. This lowered the planted area estimate by 100,000 acres. NASS yield surveys resulted in an estimated national corn yield of 175.4 bu/ac, 1.6 bu/ac lower than the July estimate.
For soybeans, production is increased by 26 million bushels. Lower estimated planted acres were offset by higher projected yields with the national soybean yield estimate increased to 51.9 bu/ac or 0.4 bu/ac above the USDA trendline yield of 51.5 bu/ac. In historic terms, projected yield changes of 1.6 bu/ac for corn and 0.4 bu/ac for soybeans are relatively small. The previous twelve year average absolute change in USDA-projected yields from July to August was 5.0 bu/ac for soybeans and 1.8 bu/ac for soybeans (See: farmdoc daily July 18, 2022).
With lower estimated corn production, use estimates are also lowered. Both feed and residual and exports are 25 million bushels lower than in the July report. Other domestic use is increased slightly, but 2022/23 corn use for ethanol (part of domestic use, but not listed in Table 1) remains unchanged from the July estimate at 5,375 million bushels. Lower corn use does not fully offset production declines so the stocks-to-use ratio decreases from 10.1 to 9.6% percent. Note that corn ending stocks-to-use remains near the threshold level of ten percent. Historically, prices have been higher and more volatile when corn stocks-to-use falls below ten percent. (See: farmdoc daily April 9, 2015)
Soybean exports and residual use for 2022/23 are increased slightly, with total use increasing 21 million bushels relative to the July report. Nearly all of this increase comes from higher projected soybean exports. This slight increase in use in response to what would be a record US soybean yield results in a modest increase in the ending-stocks-to-use ratio from 5.1 to 5.4 percent. Similar to corn, ending stocks remain historically tight in spite of the prospects for a large US crop.
The Magnitude of Changes in Corn and Soybean Use
USDA production estimates have garnered the most scrutiny since the release of the August WASDE report. Concurrent changes in use were smaller and followed changes in production, suggesting little in the way of news about demand for new-crop corn and soybeans. Going forward, domestic demand shifts are likely as changes in gasoline markets drive ethanol use. Export demand changes are also forthcoming as the prospects for South American corn and soybean production become clearer following spring planting in the southern hemisphere.
An open question is when USDA will incorporate changes in corn and soybean demand into estimates of 2022/23 corn and soybean use? For example, implied gasoline use in the US in 2022 is well below pre-pandemic levels and even below last year’s amount (See: Reuters, August 9, 2022) Continued lower gasoline use would imply less corn used for ethanol, yet current WASDE estimates for 2022/23 domestic food, seed, and industrial use for corn are at the highest level since 2017/18 and similar to the quantity estimated for 2021/22. This may appear to some to be a “no-change” forecast in the presence of tangible changes to underlying economic fundamentals.
Historic experience shows possible forthcoming changes in corn and soybean use are likely to be smaller than observed changes in production, particularly for domestic uses like corn for feed or ethanol or domestic soybean crushing. Figures 1 and 2 show US production and use by major categories for corn and soybeans respectively since the 1990/91 marketing year. The food, seed, and industrial category for corn is largely but not entirely use in ethanol production. The figure also adds linear trends for each variable (though these trends are not always based on the entire data series.)
Visual inspection of Figures 1 and 2 suggests production variability is greater than use variability. Year-to-year fluctuations in production dominate the graph. However, production is necessarily higher in levels than any individual use category. Both production and use have also trended upward over time, so some part of observed volatility is caused by predictable, expected increases.
To make observed fluctuations in WASDE balance sheet variables comparable, I calculate a modified coefficient of variation for the deviations from trend for each variable. Coefficient of variation is a unitless measure of variability given by the ratio of the standard deviation to the mean. In this case, I divide the standard deviation of the departures from trendline levels shown in figures 1 and 2 by the trendline prediction level for 2022/23. This modified coefficient of variation shows how variable each WASDE balance sheet measure is after accounting for the absolute level and trend in the data.
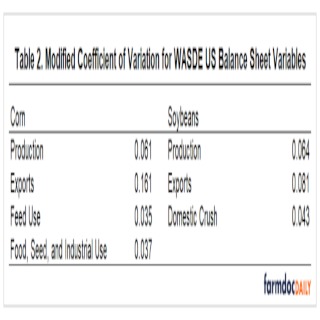
Table 2 shows the modified coefficient of variation for each variable given in figures 1 and 2. Both corn and soybean production display similar levels of variability; the coefficient of variation is around 0.06. Domestic corn and soybean use are much more stable than production or exports. The coefficient of variation for domestic use categories is about 58-68% of that for production. Exports are more variable than all other categories, especially for corn. For corn, variability over time in feed and residual and food, seed, and industrial use is remarkably similar.
Of course, large changes in 2022/23 corn and soybean use were unlikely to occur in the August WASDE or preceding reports. The new-crop marketing year only begins on September 1, so the expected size of the forthcoming harvest dominates market news before actual new-crop use can occur. Moreover, the demand side of the balance sheet is subject to broader, more complex economic fundamentals. Opportunities for substitution in commodity demand are generally possible at all times whereas supply response is extremely limited once a crop is planted. However, figures 1 and 2 show year-to-year variation in corn and soybean use is not zero and a “no-change” forecast like that observed in some parts of the August WASDE report is unlikely to persist.
Conclusions
The August WASDE report made sizeable changes to new-crop 2022/23 US corn and soybean production. Corn production estimates were decreased and soybean production estimates increased. The effect on the overall tightness of the balance sheet was somewhat offset by revisions to expected corn and soybean use in both cases. However, estimated year-over-year changes in corn and soybean use are small in historic terms, what appears to be a “no-change” forecast. While domestic use tends to be more stable than production or exports, news about new-crop corn and soybean demand will grow in importance as the summer growing season winds down in the US corn belt. Updated use numbers are likely to feature in forthcoming WASDE reports.
Source : illinois.edu