Overview
Corn and wheat were down; soybeans were up; and cotton was mixed for the week.
Prices are hopefully starting to stabilize or bottom for most agricultural commodities. Less volatility in futures has been evident in the past week. A return to more normal price discovery in agricultural futures markets would assist producers in using markets as an effective risk management tool.
The U.S. ethanol industry remains severely depressed and on the verge of economic ruin. Prior to COVID-19, production was consistently above 1 million barrels a week, last week production was 537,000 or about half. This effects DDGs for export and livestock use and domestic corn demand.
U.S. export sales and shipments were strong this past week triggering a price rally in crops on Thursday. Increased buying from China was evident for both soybeans and cotton, providing cautious optimism. Export sales are encouraging given the competition out of Brazil with a record crop and historically low currency exchange rates. The Brazilian Real (BRL) has devalued 71%. On June 1, 2017 a bushel of soybeans were $9.42 USD, equivalent of 30.39 BRL per bushel at the time. On April 29, 2020 soybeans were $8.31 USD, equivalent to 45.77 BRL. The devalued Brazilian Real makes their exported agricultural commodities more price competitive for international purchasers. However, this does make inputs imported to Brazil such as fertilizer and fuel much more expensive, due to a lack of buying power.
Details on the $16 billion in CFAP direct payments to livestock, specialty crop, and row crop producers from USDA may be released next week. Producers are strongly encouraged to get inventory numbers and sales data for all commodities on the farm from January 1 to present so they can quickly act on the CFAP direct payment program. $16 billion is likely to be insufficient to cover eligible losses.
Corn
Ethanol production for the week ending April 24 was 0.537 million barrels per day, down 26,000 barrels from the previous week. Ethanol stocks were 26.337 million barrels, down 1.352 million barrels compare to last week. Corn net sales reported by exporters for April 17-23 were up compared to last week with net sales of 53.4 million bushels for the 2019/20 marketing year and 13.3 million bushels for the 2020/21 marketing year. Exports for the same time period were up 27% from last week at 41.4 million bushels. Corn export sales and commitments were 84% of the USDA estimated total exports for the 2019/20 marketing year (September 1 to August 31) compared to the previous 5-year average of 89%. Across Tennessee, average corn basis (cash price-nearby futures price) weakened or remained unchanged at Memphis, Northwest Barge Points, Northwest, and Upper-middle Tennessee. Overall, basis for the week ranged from 13 under to 28 over, with an average of 4 over the May futures at elevators and barge points. May 2020 corn futures closed at $3.11, down 4 cents since last Friday. For the week, May 2020 corn futures traded between $3.00 and $3.15. May/Jul and May/Dec future spreads were 7 and 25 cents. July 2020 corn futures closed at $3.18, down 5 cents since last Friday.
Corn | May 20 | Change | Dec 20 | Change |
Price | $3.11 | -$0.04 | $3.36 | $0.00 |
Support | $2.99 | -$0.11 | $3.27 | -$0.04 |
Resistance | $3.19 | -$0.08 | $3.44 | -$0.02 |
20 Day MA | $3.19 | -$0.08 | $3.41 | -$0.05 |
50 Day MA | $3.43 | -$0.08 | $3.59 | -$0.05 |
100 Day MA | $3.66 | -$0.04 | $3.78 | -$0.03 |
4-Week High | $3.43 | -$0.09 | $3.53 | -$0.16 |
4-Week Low | $3.00 | -$0.01 | $3.25 | $0.00 |
Technical Trend | Strong Down | = | Down | - |
Nationally the Crop Progress report estimated corn planting at 27% compared to 7% last week, 12% last year, and a 5-year average of 20%; and corn emerged was 3% compared to 2% last year and a 5-year average of 4%. In Tennessee, the Crop Progress report estimated corn planted at 35% compared to 23% last week, 36% last year, and a 5-year average of 42%; and corn emerged at 13% compared to 3% last week, 16% last year, and a 5-year average of 15%. In Tennessee, new crop cash corn contracts ranged from $3.04 to $3.33. December 2020 corn futures closed at $3.36, unchanged since last Friday. Downside price protection could be obtained by purchasing a $3.40 December 2020 Put Option costing 26 cents establishing a $3.14 futures floor.
Soybeans
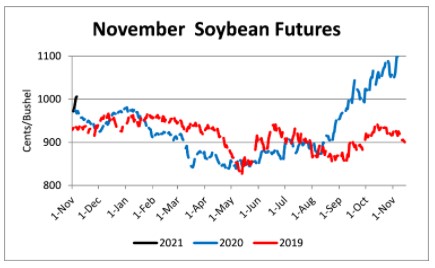
Net sales reported by exporters were up compared to last week with net sales of 39.6 million bushels for the 2019/20 marketing year and 3.9 million bushels for the 2020/21 marketing year. Exports for the same period were up 8% compared to last week at 21.0 million bushels. Soybean export sales and commitments were 81% of the USDA estimated total annual exports for the 2019/20 marketing year (September 1 to August 31), compared to the previous 5-year average of 96%. Average soybean basis weakened or remained unchanged at Memphis, Northwest Barge Points, Northwest, and Upper-middle Tennessee. Basis ranged from 29 under to 29 over the May futures contract at elevators and barge points. Average basis at the end of the week was 9 over the May futures contract. May 2020 soybean futures closed at $8.47, up 15 cents since last Friday. For the week, May 2020 soybean futures traded between $8.22 and $8.51. May/Jul and May/Nov future spreads were 2 and 8 cents. July 2020 soybean futures closed at $8.49, up 10 cents since last Friday. May soybean-to-corn price ratio was 2.72 at the end of the week.
Soybeans | May 20 | Change | Nov 20 | Change |
Price | $8.47 | $0.15 | $8.55 | $0.14 |
Support | $8.27 | $0.02 | $8.47 | $0.19 |
Resistance | $8.62 | $0.07 | $8.62 | $0.04 |
20 Day MA | $8.42 | -$0.09 | $8.55 | -$0.06 |
50 Day MA | $8.62 | -$0.06 | $8.72 | -$0.08 |
100 Day MA | $8.96 | -$0.03 | $9.10 | -$0.04 |
4-Week High | $8.70 | -$0.27 | $8.82 | -$0.05 |
4-Week Low | $8.08 | $0.00 | $8.31 | $0.00 |
Technical Trend | Down | + | Down | - |
Nationally the Crop Progress report estimated soybean planting at 8% compared to 2% last week, 2% last year, and a 5-year average of 4%. In Tennessee, soybeans planted were estimated at 8% compared to 2% last week, 2% last year, and a 5-year average of 3%. In Tennessee, new crop soybean cash contracts ranged from $8.06 to $9.10. Nov/Dec 2020 soybean-to-corn price ratio was 2.54 at the end of the week. November 2020 soybean futures closed at $8.55, up 14 cents since last Friday. Downside price protection could be achieved by purchasing an $8.60 November 2020 Put Option which would cost 43cents and set an $8.17 futures floor.
Cotton
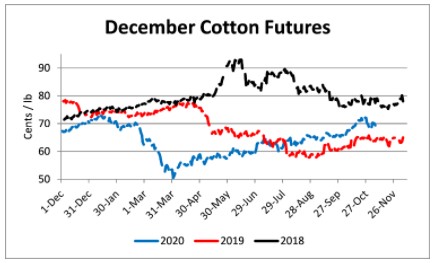
Net sales reported by exporters were up compared to last week with net sales of 434,800 bales for the 2019/20 marketing year and 148,500 bales for the 2020/21 marketing year. Exports for the same time period were down 5% compared to last week at 253,700 bales. Upland cotton export sales were 112% of the USDA estimated total annual exports for the 2019/20 marketing year (August 1 to July 31), compared to the previous 5-year average of 100%. Delta upland cotton spot price quotes for April 30 were 54.33 cents/lb (41-4-34) and 56.58 cents/lb (31-3-35). Adjusted World Price (AWP) increased 1.74 cents to 46.99 cents. May 2020 cotton futures closed at 56.56 cents, up 1.63 cents since last Friday. For the week, May 2020 cotton futures traded between 53.93 and 58.06 cents. May/Jul and May/Dec cotton futures spreads were -0.72 cents and 0.96 cents. July 2020 cotton futures closed at 55.84 cents, up 0.21 cents since last Friday.
Cotton | May 20 | Change | Dec 20 | Change |
Price | 56.56 | 1.63 | 57.52 | -0.15 |
Support | 55.98 | 2.56 | 55.85 | -0.59 |
Resistance | 56.82 | -0.54 | 59.85 | 0.87 |
20 Day MA | 54.35 | 1.56 | 56.13 | 1.40 |
50 Day MA | 56.87 | -1.25 | 58.30 | -1.16 |
100 Day MA | 63.24 | -0.46 | 64.18 | -0.47 |
4-Week High | 58.06 | 0.11 | 59.50 | 0.65 |
4-Week Low | 48.58 | 0.23 | 50.18 | 0.00 |
Technical Trend | Down | = | Down | = |
Nationally, the Crop Progress report estimated cotton planted at 13%, compared to 11% last week, 10% last year, and a 5-year average of 11%. In Tennessee, cotton planted was estimated at 2% compared to 1% last year and a 5-year average of 3%. December 2020 cotton futures closed at 57.52, down 0.15 cents since last Friday. Downside price protection could be obtained by purchasing a 58 cent December 2020 Put Option costing 3.92 cents establishing a 54.08 cent futures floor.
Wheat
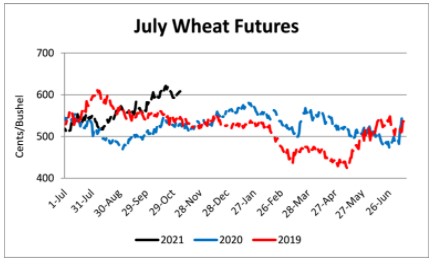
Wheat net sales reported by exporters were up compared to last week with net sales of 17.2 million bushels for the 2019/20 marketing year and 5.7 million bushels for the 2020/21 marketing year. Exports for the same time period were down 19% from last week at 16.1 million bushels. Wheat export sales were 97% of the USDA estimated total annual exports for the 2019/20 marketing year (June 1 to May 31), compared to the previous 5-year average of 104%. May 2020 wheat futures closed at $5.21, down 5 cents since last Friday. May 2020 wheat futures traded between $5.11 and $5.30 this week. May wheat-to-corn price ratio was 1.68. May/Jul and May/Sep future spreads were -5 and -1 cents.
Wheat | May 20 | Change | Jul 20 | Change |
Price | $5.21 | -$0.05 | $5.16 | -$0.14 |
Support | $5.15 | $0.06 | $5.08 | -$0.07 |
Resistance | $5.31 | -$0.28 | $5.26 | -$0.30 |
20 Day MA | $5.39 | -$0.10 | $5.39 | $0.93 |
50 Day MA | $5.36 | -$0.03 | $5.35 | -$0.03 |
100 Day MA | $5.46 | $0.00 | $5.45 | -$0.01 |
4-Week High | $5.64 | -$0.23 | $5.64 | -$0.07 |
4-Week Low | $5.11 | -$0.13 | $5.06 | -$0.19 |
Technical Trend | Down | = | Down | = |
Nationally the Crop Progress report estimated winter wheat condition at 54% good-to-excellent and 15% poor-to-very poor; winter wheat headed at 21% compared to 14% last week, 16% last year, and a 5-year average of 25%; and spring wheat planted at 14% compared to 7% last week, 11% last year, and a 5-year average of 29%. In Tennessee, winter wheat condition was estimated at 62% good-to-excellent and 3% poor-to-very poor; winter wheat jointing at 95% compared to 87% last week, 92% last year, and a 5-year average of 90%; and winter wheat headed at 58% compared to 26% last week, 36% last year, and a 5-year average of 36%. In Tennessee, June/July 2020 cash contracts ranged from $4.97 to $5.49. July 2020 wheat futures closed at $5.16, down 14 cents since last Friday. Downside price protection could be obtained by purchasing a $5.20 July 2020 Put Option costing 25 cents establishing a $4.95 futures floor. July wheat-to-corn price ratio was 1.62. September 2020 wheat futures closed at $5.20, down 13 cents since last Friday.
Source : tennessee.edu