Overview
?Corn, soybeans, cotton, and wheat were up for the week.
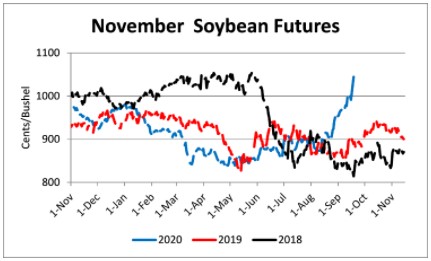
What a difference a month makes! On August 18, November soybeans closed at $9.13 ¾. Since then, soybeans have went on a dramatic run to close Friday at $10.43 ½, a $1.29 ¾ cent rally. The rally has been fueled by very strong export sales (primarily to China) and weather concerns domestically and in South America. A run up to $11 cannot be ruled out (neither can a retreat in prices down to $9.50) due to the uncertainties with Chinese buying and weather conditions. Producers are encouraged to evaluate their production potential and pencil out potential returns for the 2020 crop. This should include both priced and unpriced production and estimated government payments for the 2020 crop. The producer will then need to decide if fixing a price on the remainder of production at current levels provides sufficient returns or if they would prefer to hold out for potentially higher prices and accept the downside risk.
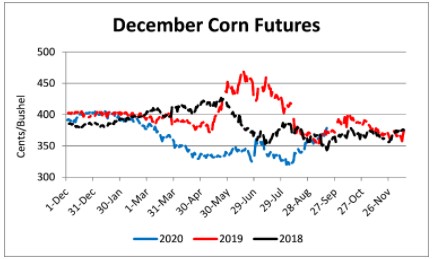
December corn has rallied from $3.41 ¾ on August 18 to $3.78 ½ on September 18th, a 36 ¾ cent increase. Given Tennessee’s historical basis, producers may want to consider securing a futures price, or leaving stored production unpriced; accepting the affiliated downside risk, and wait for basis to improve this winter. In Tennessee, storing corn and selling soybeans seems to be the more prudent strategy at this juncture.
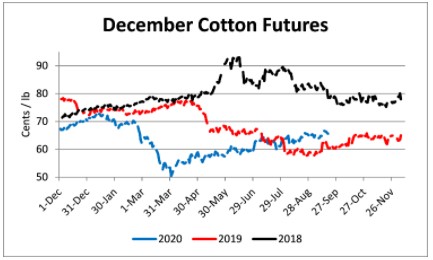
December cotton set a new 6-month contract high this week at 66.93 before falling back to the mid-65-cent range on Friday. Cotton export sales were again very strong this week with over 519,600 bales in new sales. Strong export sales, the drought in Texas, and hurricane activity will continue to dictate price direction.
December wheat has jumped 40 cents the past two trading days due to drought conditions in the southern and northern plains plus recent weather forecasts indicating a drier than normal winter and production concerns in Argentina. A run up to $6.00 is possible if wheat futures can hold the $5.80 level early next week.
Coronavirus Food Assistance Program 2, or CFAP 2, will provide row crop producers with payments for the 2020 crop. USDA will accept CFAP 2 applications from September 21, 2020 through December 11, 2020. Further details are available on USDA's Farmers.gov website.
Corn
Ethanol production for the week ending September 11 was 0.926 million barrels per day, down 15,000 barrels from the previous week. Ethanol stocks were 19.798 million barrels, down 0.195 million barrels compared to last week. Corn net sales reported by exporters for September 4-10 were down compared to last week with net sales of 63.4 million bushels for the 2020/21 marketing year. Exports for the same time period were up 1% from last week at 35.5 million bushels. Corn export sales and commitments were 35% of the USDA estimated total exports for the 2020/21 marketing year (September 1 to August 31) compared to the previous 5-year average of 25%.
Corn | Dec 20 | Change | Mar 21 | Change |
Price | $3.78 | $0.10 | $3.87 | $0.09 |
Support | $3.71 | $0.10 | $3.79 | $0.08 |
Resistance | $3.83 | $0.10 | $3.92 | $0.10 |
20 Day MA | $3.60 | $0.08 | $3.71 | $0.07 |
50 Day MA | $3.43 | $0.01 | $3.54 | $0.01 |
100 Day MA | $3.41 | $0.02 | $3.53 | $0.02 |
4-Week High | $3.79 | $0.10 | $3.88 | $0.09 |
4-Week Low | $3.35 | $0.15 | $3.48 | $0.17 |
Technical Trend | Up | = | Up | = |
Nationally the Crop Progress report estimated corn condition at 60% good-to-excellent and 15% poor-to-very poor; corn dented at 89% compared to 79% last week, 64% last year, and a 5-year average of 82%; corn mature at 41% compared to 25% last week, 16% last year, and a 5-year average of 32%; and corn harvested at 5% compared to 3% last year and a 5-year average of 5%. In Tennessee, the Crop Progress report estimated corn condition at 73% good-to-excellent and 4% poor-to-very poor; corn dented at 96% compared to 88% last week, 96% last year, and a 5-year average of 97%; corn mature at 61% compared to 45% last week, 78% last year, and a 5-year average of 80%; and corn harvested at 12% compared to 4% last week, 32% last year, and a 5-year average of 32%. Across Tennessee, average corn basis (cash price-nearby futures price) strengthened or remained unchanged at Mississippi River, West-Central, North-Central, Northwest, and West elevators and barge point. Overall, basis for the week ranged from 25 under to 17 over, with an average of 1 under the December futures. December 2020 corn futures closed at $3.78, up 10 cents since last Friday. For the week, December 2020 corn futures traded between $3.61 and $3.79. Dec/Mar and Dec/Dec future spreads were 9 and 15 cents. Downside price protection could be obtained by purchasing a $3.80 December 2020 Put Option costing 15 cents establishing a $3.65 futures floor. In Tennessee, new crop cash corn contracts ranged from $3.41 to $4.03. March 2021 corn futures closed at $3.87, up 9 cents since last Friday. December 2021 corn futures closed at $3.93, up 4 cents since last Friday.
Soybeans
Net sales reported by exporters were down compared to last week with net sales of 90.3 million bushels for the 2020/21 marketing year. Exports for the same period were up 3% compared to last week at 63.7 million bushels. Soybean export sales and commitments were 56% of the USDA estimated total annual exports for the 2020/21 marketing year (September 1 to August 31), compared to the previous 5-year average of 34%.
Soybeans | Nov 20 | Change | Jan 21 | Change |
Price | $10.43 | $0.47 | $10.47 | $0.48 |
Support | $10.31 | $0.65 | $10.22 | $0.51 |
Resistance | $10.58 | $0.46 | $10.62 | $0.48 |
20 Day MA | $9.67 | $0.26 | $9.72 | $0.25 |
50 Day MA | $9.21 | $0.11 | $9.27 | $0.12 |
100 Day MA | $8.94 | $0.09 | $8.98 | $0.09 |
4-Week High | $10.46 | $0.48 | $10.50 | $0.50 |
4-Week Low | $9.01 | $0.34 | $9.08 | $0.36 |
Technical Trend | Up | = | Up | = |
Nationally the Crop Progress report estimated soybean condition at 63% good-to-excellent and 11% poor-to-very poor; and soybeans dropping leaves at 37% compared to 20% last week, 13% last year, and a 5-year average of 31%. In Tennessee, soybean condition was estimated at 75% good-to-excellent and 5% poor-to-very poor; soybeans setting pods at 97% compared to 94% last week, 97% last year, and a 5-year average of 98%; soybeans dropping leaves at 24% compared to 15% last week, 36% last year, and a 5-year average of 34%; and soybeans harvested at 2% compared to 0% last week, 7% last year, and a 5-year average of 3%. Across Tennessee, average soybean basis weakened at West-Central and West and strengthened or remained unchanged at North-Central, Northwest, and Mississippi River elevators and barge points. Basis ranged from 14 under to 35 over the November futures contract. Average basis at the end of the week was 10 over the November futures contract. November 2020 soybean futures closed at $10.73, up 47 cents since last Friday. For the week, November 2020 soybean futures traded between $9.85 and $10.46. Nov/Jan and Nov/Nov future spreads were 4 and -67 cents. November/December soybean-to-corn price ratio was 2.76 at the end of the week. Downside price protection could be achieved by purchasing a $10.50 November 2020 Put Option which would cost 33 cents and set a $10.17 futures floor. In Tennessee, new crop soybean cash contracts ranged from $9.78 to $10.65. January 2021 soybean futures closed at $10.47, up 48 cents since last Friday. November 2021 soybean futures closed at $9.76, up 25 cents since last Friday. Nov/Dec 2021 soybean-to-corn price ratio was 2.48 at the end of the week.
Cotton
Net sales reported by exporters were up compared to last week with net sales of 519,600 bales for the 2020/21 marketing year. Exports for the same time period were down 18% compared to last week at 187,900 bales. Upland cotton export sales were 56% of the USDA estimated total annual exports for the 2020/21 marketing year (August 1 to July 31), compared to the previous 5-year average of 49%. Delta upland cotton spot price quotes for September 17 were 61.85 cents/lb (41-4-34) and 64.10 cents/lb (31-3-35). Adjusted World Price (AWP) increased 1.11 cents to 50.88 cents.
Cotton | Dec 20 | Change | Mar 21 | Change |
Price | 65.66 | 0.85 | 66.58 | 0.80 |
Support | 64.73 | 0.72 | 65.75 | 0.72 |
Resistance | 66.61 | 0.60 | 67.45 | 0.50 |
20 Day MA | 65.26 | 0.68 | 66.17 | 0.66 |
50 Day MA | 63.81 | 0.27 | 64.63 | 0.30 |
100 Day MA | 61.53 | 0.43 | 62.30 | 0.43 |
4-Week High | 66.93 | 0.48 | 67.79 | 0.49 |
4-Week Low | 62.83 | 0.72 | 63.75 | 0.67 |
Technical Trend | Up | + | Up | = |
Nationally, the Crop Progress report estimated cotton condition at 45% good-to-excellent and 27% poor-to-very poor; cotton bolls opening at 47% compared to 37% last week, 51% last year, and a 5-year average of 45%; and cotton harvested at 6% compared to 8% last year and a 5-year average of 8%. In Tennessee, cotton condition was estimated at 65% good-to-excellent and 18% poor-to-very poor; cotton bolls opening at 29% compared to 15% last week, 41% last year, and a 5-year average of 51%. December 2020 cotton futures closed at 65.66, up 0.85 cents since last Friday. For the week, December 2020 cotton futures traded between 64.81 and 66.93 cents. Dec/Mar and Dec/Dec cotton futures spreads were 0.92 cent and 0.31 cents. Downside price protection could be obtained by purchasing a 66 cent December 2020 Put Option costing 2.31 cents establishing a 63.69 cent futures floor. March 2021 cotton futures closed at 66.58 cents, down 0.8 cents since last Friday. December 2021 cotton futures closed at 65.97 cents, up 0.77 cents since last Friday.
Wheat
Wheat net sales reported by exporters were down compared to last week with net sales of 12.3 million bushels for the 2020/21 marketing year and 0.01 for the 2021/22 marketing year. Exports for the same time period were down 22% from last week at 20.7 million bushels. Wheat export sales were 50% of the USDA estimated total annual exports for the 2020/21 marketing year (June 1 to May 31), compared to the previous 5-year average of 50%.
Wheat | Dec 20 | Change | Jul 21 | Change |
Price | $5.75 | $0.33 | $5.82 | $0.25 |
Support | $5.47 | $0.15 | $5.58 | $0.09 |
Resistance | $5.92 | $0.35 | $5.96 | $0.27 |
20 Day MA | $5.47 | $0.08 | $5.59 | $0.07 |
50 Day MA | $5.34 | $0.04 | $5.45 | $0.04 |
100 Day MA | $5.25 | $0.00 | $5.36 | $0.01 |
4-Week High | $5.78 | $0.10 | $5.85 | $0.09 |
4-Week Low | $5.15 | $0.18 | $5.30 | $0.16 |
Technical Trend | Up | = | Up | = |
Nationally the Crop Progress report estimated winter wheat planted at 10% compared to 5% last week, 6% last year, and a 5-year average of 8%; and spring wheat harvested at 92% compared to 82% last week, 75% last year, and a 5-year average of 92%. In Tennessee winter wheat planted was estimated at 1%. In Tennessee, September 2020 wheat cash contracts ranged from $5.58 to $5.76. December 2020 wheat futures closed at $5.75, up 33 cents since last Friday. December 2020 wheat futures traded between $5.33 and $5.78 this week. December wheat-to-corn price ratio was 1.52. Dec/Mar and Dec/Jul future spreads were 7 and 7 cents. March 2021 wheat futures closed at $5.82, up 25 cents since last Friday. July 2021 wheat futures closed at $5.82, 25 cents since last Friday. Downside price protection could be obtained by purchasing a $5.90 July 2021 Put Option costing 48 cents establishing a $5.42 futures floor.
Source : tennessee.edu