Overview
Cotton and wheat were down; soybeans and corn were mixed for the week.
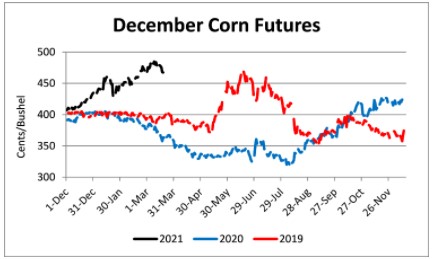
December corn futures established a contract high of $4.85 ¾ on March 8. Since then, prices have dropped 15 cents closing Friday at $4.70 ¼. The 50-day moving average of $4.60 is a key support level. If prices fall below the 50-day moving average further declines should be expected. At current prices, producers need to consider taking some of the downside risk off the table.
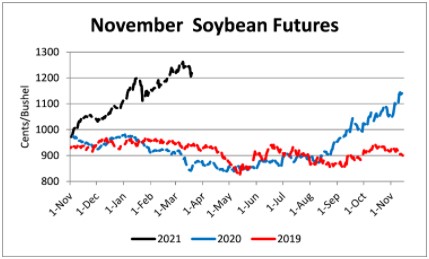
November soybeans dropped 29 ¼ cents on Thursday before recovering about half of the loss on Friday. New crop cash prices for soybeans above $12.00 and trend line yield or greater will result in profitable outcomes for many Tennessee producers. However, inputs have increased substantially over the winter so revisiting cost of production estimates to determine projected profitability is advised.
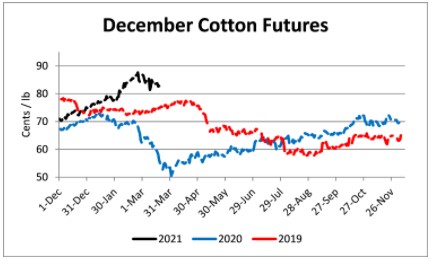
December cotton futures have tumbled off the February 25 high of 89.28 cents. While another run up towards 90 cents is not out of the question, it seems more likely that, in the short term, cotton will trade in a 80-86 cent range – at least until more information is revealed about U.S. planted acres and drought conditions in the Southern Plains. Volatility in the cotton market has been substantial since February 24 with eight triple digit daily swings in the past 17 trading days. Extreme price movements can bring added emotion to marketing, which is rarely a positive when making risk management decisions. Having a written marketing plan based on profitability and risk tolerance will help avoid emotional decisions that a marketer regrets.
July wheat prices have decreased for three consecutive weeks. The weather outlook has improved for key HRW wheat states and some of the fears regarding winter kill due to cold winter weather appear to have subsided. The July contract has moved below the 100-day moving average – potentially indicating further weakness. With Tennessee harvest cash prices for SRW wheat near $6.50 producers may want to consider adding to existing sales.
Corn
Ethanol production for the week ending March 12 was 0.971 million barrels per day, up 33,000 barrels from the previous week. Ethanol stocks were 21.340 million barrels, down 0.730 million barrels compared to last week. Corn net sales reported by exporters for March 5-11 were up compared to last week with net sales of 38.8 million bushels for the 2020/21 marketing year and 9.5 million bushels for the 2021/22 marketing year. Exports for the same time period were up 38% from last week at 86.6 million bushels (a marketing year high). Corn export sales and commitments were 92% of the USDA estimated total exports for the 2020/21 marketing year (September 1 to August 31) compared to the previous 5-year average of 75%. Across Tennessee, average corn basis (cash price-nearby futures price) strengthened or remained unchanged at North-Central, West-Central, West, and Mississippi River and weakened at Northwest elevators and barge points. Overall, basis for the week ranged from 15 over to 42 over, with an average of 28 over the May futures at elevators and barge points. May 2021 corn futures closed at $5.57, up 18 cents since last Friday. For the week, May 2021 corn futures traded between $5.32 and $5.59. May/Jul and May/Dec future spreads were -19 and -86 cents. July 2021 corn futures closed at $5.38, up 10 cents since last Friday.
Corn | May 21 | Change | Dec 21 | Change |
Price | $5.57 | $0.18 | $4.71 | -$0.07 |
Support | $5.37 | $0.11 | $4.61 | -$0.14 |
Resistance | $5.62 | $0.15 | $4.79 | -$0.08 |
20 Day MA | $5.46 | $0.02 | $4.75 | $0.04 |
50 Day MA | $5.38 | $0.07 | $4.60 | $0.04 |
100 Day MA | $4.86 | $0.07 | $4.35 | $0.04 |
4-Week High | $5.59 | $0.00 | $4.85 | $0.00 |
4-Week Low | $5.29 | $0.00 | $4.62 | $0.15 |
Technical Trend | Up | + | Up | = |
In Tennessee, new crop cash corn prices at elevators and barge points ranged from $4.48 to $5.01. December 2021 corn futures closed at $4.71, down 7 cents since last Friday. Downside price protection could be obtained by purchasing a $4.80 December 2021 Put Option costing 49 cents establishing a $4.31 futures floor.
Soybeans
Net sales reported by exporters were down compared to last week with net sales of 7.4 million bushels for the 2020/21 marketing year. Exports for the same period were down 24% compared to last week at 19.6 million bushels. Soybean export sales and commitments were 99% of the USDA estimated total annual exports for the 2020/21 marketing year (September 1 to August 31), compared to the previous 5-year average of 86%. Across Tennessee, average soybean basis weakened or remained unchanged at West, West-Central, North-Central, Northwest, and Mississippi River elevators and barge points. Basis ranged from 5 over to 33 over the May futures contract. Average basis at the end of the week was 15 over the May futures contract. May 2021 soybean futures closed at $14.16, up 3 cents since last Friday. For the week, May 2021 soybean futures traded between $13.90 and $14.25. May/Jul and May/Nov future spreads were -13 and -196 cents. May 2021 soybean-to-corn price ratio was 2.54 at the end of the week. July 2021 soybean futures closed at $14.03, up 1 cent since last Friday.
Soybeans | May 21 | Change | Nov 21 | Change |
Price | $14.16 | $0.03 | $12.20 | -$0.23 |
Support | $13.72 | -$0.18 | $11.85 | -$0.34 |
Resistance | $14.29 | -$0.05 | $12.45 | -$0.14 |
20 Day MA | $14.13 | $0.09 | $12.33 | $0.11 |
50 Day MA | $13.89 | $0.09 | $11.93 | $0.11 |
100 Day MA | $12.81 | $0.18 | $11.19 | $0.12 |
4-Week High | $14.60 | $0.00 | $12.65 | $0.00 |
4-Week Low | $13.74 | $0.06 | $11.97 | $0.21 |
Technical Trend | Up | = | Up | = |
In Tennessee, new crop cash soybean prices at elevators and barge points ranged from $12.02 to $12.81. November 2021 soybean futures closed at $12.20, down 23 cents since last Friday. Downside price protection could be achieved by purchasing a $12.40 November 2021 Put Option which would cost 94 cents and set an $11.46 futures floor. Nov/Dec 2021 soybean-to-corn price ratio was 2.59 at the end of the week.
Cotton
Net sales reported by exporters were up compared to last week with net sales of 437,700 bales for the 2020/21 marketing year and 143,300 bales for the 2021/22 marketing year. Exports for the same time period were up <1% compared to last week at 351,900 bales. Upland cotton export sales were 99% of the USDA estimated total annual exports for the 2020/21 marketing year (August 1 to July 31), compared to the previous 5-year average of 93%. Delta upland cotton spot price quotes for March 18 were 83.20 cents/lb (41-4-34) and 85.45 cents/lb (31-3-35). Adjusted World Price (AWP) increased 0.75 cents to 71.45 cents. May 2021 cotton futures closed at 84.68, down 2.88 cents since last Friday. For the week, May 2021 cotton futures traded between 83.65 and 87.87 cents. May/Jul and May/Dec cotton futures spreads were 1.04 cents and -2.17 cents. July 2021 cotton futures closed at 85.72 cents, down 2.85 cents since last Friday.
Cotton | May 21 | Change | Dec 21 | Change |
Price | 84.68 | -2.88 | 82.51 | -1.51 |
Support | 82.57 | -2.22 | 81.13 | -0.96 |
Resistance | 86.83 | -3.04 | 83.77 | -2.18 |
20 Day MA | 88.36 | -0.94 | 84.56 | -0.41 |
50 Day MA | 85.82 | 0.63 | 81.72 | 0.77 |
100 Day MA | 80.04 | 0.68 | 76.60 | 0.63 |
4-Week High | 95.60 | 0.00 | 89.28 | 0.00 |
4-Week Low | 82.87 | 0.00 | 80.44 | 0.00 |
Technical Trend | Down | = | Down | = |
December 2021 cotton futures closed at 82.51 cents, down 1.51 cents since last Friday. Downside price protection could be obtained by purchasing an 83 cent December 2021 Put Option costing 6.72 cents establishing a 76.28 cent futures floor.
Wheat
Wheat net sales reported by exporters were up compared to last week with net sales of 14.3 million bushels for the 2020/21 marketing year and 5.1 million bushels for the 2021/22 marketing year. Exports for the same time period were up 41% from last week at 24.3 million bushels. Wheat export sales were 92% of the USDA estimated total annual exports for the 2020/21 marketing year (June 1 to May 31), compared to the previous 5-year average of 97%. In Tennessee, spot wheat prices ranged from $6.65 to $6.82. May 2021 wheat futures closed at $6.27, down 11 cents since last Friday. May 2021 wheat futures traded between $6.21 and $6.49 this week. May wheat-to-corn price ratio was 1.13. May/Jul and May/Sep future spreads were -8 and -8 cents.
Wheat | May 21 | Change | Jul 21 | Change |
Price | $6.27 | -$0.11 | $6.19 | -$0.13 |
Support | $6.14 | -$0.14 | $6.09 | -$0.14 |
Resistance | $6.41 | -$0.21 | $6.31 | -$0.22 |
20 Day MA | $6.53 | -$0.04 | $6.43 | -$0.03 |
50 Day MA | $6.53 | -$0.01 | $6.41 | $0.00 |
100 Day MA | $6.31 | $0.01 | $6.22 | $0.01 |
4-Week High | $6.88 | $0.00 | $6.72 | $0.00 |
4-Week Low | $6.21 | -$0.16 | $6.15 | -$0.16 |
Technical Trend | Down | = | Down | = |
?
In Tennessee, new crop wheat cash contracts ranged from $6.09 to $6.61. July 2021 wheat futures closed at $6.19, down 13 cents since last Friday. Downside price protection could be obtained by purchasing a $6.20 July 2021 Put Option costing 36 cents establishing a $5.84 futures floor. September 2021 wheat futures closed at $6.19, down 13 cents since last Friday.
Source : tennessee.edu