Overview
Corn, cotton, soybeans, and wheat were up for the week.
The April WASDE report was released on Friday, April 9, 2021. Overall the report provided minor adjustments to global supply and demand, however the report can be considered moderately bullish for wheat, corn, and cotton and slightly bearish for soybeans.
The big change for wheat was a reduction in projected foreign ending stocks of 224 million bushels. This was largely due to wheat being used in livestock rations due to price competitiveness with corn. US export sales of wheat continue to lag USDA projections which may require a reduction in marketing year totals in future WASDE reports.
Corn use remains very strong with US exports leading the way with a 75 million bushel increase over last month. Current US export sales will necessitate USDA increasing corn exports on future supply and demand reports, perhaps getting ending stocks near 1-1.2 billion bushels. Corn feed and residual use and ethanol were also increased 50 and 25 million bushels. Argentina’s corn production was reduced 20 million bushels and Brazil’s production was left unchanged compared to the March report.
Soybean futures declined after the report was released. US exports were increased by 30 million bushels, but were offset by reductions in domestic crush and seed and residual use. Brazil’s estimated production was increased 73 million bushels and China’s crush was reduced by 73 million bushels. Although the report failed to meet pre-report expectations for US exports/ending stocks, the long term 2021 outlook for soybean prices remains very positive.
Global cotton stocks were lowered 1.13 million bales and production was decreased 280,000 bales compared to last month. From a price standpoint, the good news is cotton reversed the downward trend and made substantial gains this week. The bad news is that triple digit moves continue to be prevalent in the market. Geo-political concerns between China and the US continue to make market demand predictions difficult. On the supply side if drought continues to intensify in the southern plains a return to 85+ cents could occur.
Corn
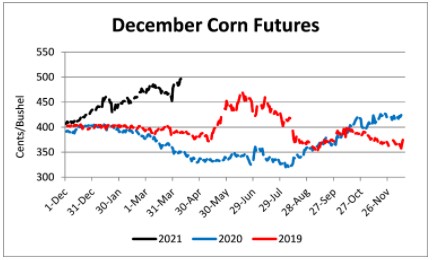
Ethanol production for the week ending April 2 was 0.975 million barrels per day, up 10,000 barrels from the previous week. Ethanol stocks were 20.642 million barrels, down 0.472 million barrels compared to last week. Corn net sales reported by exporters for March 26-April 1, 2021 were down compared to last week with net sales of 29.8 million bushels for the 2020/21 marketing year and 2.0 million bushels for the 2021/22 marketing year. Exports for the same time period were up 4% from last week at 80.8 million bushels. Corn export sales and commitments were 101% of the USDA estimated total exports for the 2020/21 marketing year (September 1 to August 31) compared to the previous 5-year average of 82%. Across Tennessee, average corn basis (cash price-nearby futures price) weakened or remained unchanged at North-Central, West-Central, Northwest, West, and Mississippi River elevators and barge points. Overall, basis for the week ranged from 15 over to 37 over, with an average of 27 over the May futures at elevators and barge points. May 2021 corn futures closed at $5.77, up 18 cents since last Friday. For the week, May 2021 corn futures traded between $5.49 and $5.95. May/Jul and May/Dec future spreads were -15 and -81 cents. July 2021 corn futures closed at $5.62, up 17 cents since last Friday.
Corn | May 21 | Change | Dec 21 | Change |
Price | $5.77 | $0.18 | $4.96 | $0.12 |
Support | $5.63 | $0.25 | $4.88 | $0.15 |
Resistance | $6.02 | $0.07 | $5.07 | $0.09 |
20 Day MA | $5.56 | $0.08 | $4.76 | $0.03 |
50 Day MA | $5.49 | $0.05 | $4.69 | $0.06 |
100 Day MA | $5.07 | $0.09 | $4.47 | $0.05 |
4-Week High | $5.95 | $0.10 | $5.03 | $0.10 |
4-Week Low | $5.32 | $0.03 | $4.49 | $0.00 |
Technical Trend | Up | = | Up | = |
In Tennessee, new crop cash corn prices at elevators and barge points ranged from $4.68 to $5.13. December 2021 corn futures closed at $4.96, up 12 cents since last Friday. Downside price protection could be obtained by purchasing a $5.00 December 2021 Put Option costing 46 cents establishing a $4.54 futures floor.
Soybeans
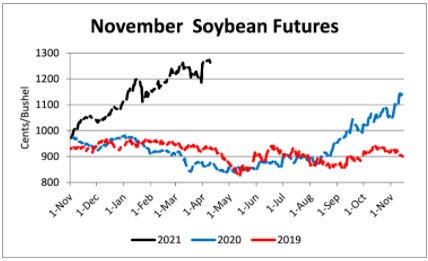
Net sales reported by exporters were up compared to last week with net sales of 3.4 million bushels for the 2020/21-- a marketing year low-- and 12.4 million bushels for the 2021/22 marketing year. Exports for the same period were down 25% compared to last week at 12.7 million bushels -- marketing year low. Soybean export sales and commitments were 99% of the USDA estimated total annual exports for the 2020/21 marketing year (September 1 to August 31), compared to the previous 5-year average of 90%. Across Tennessee, average soybean basis weakened or remained unchanged at West, West-Central, North-Central, Northwest, and Mississippi River elevators and barge points. Basis ranged from even to 26 over the May futures contract. Average basis at the end of the week was 13 over the May futures contract. May 2021 soybean futures closed at $14.03, up 1 cent since last Friday. For the week, May 2021 soybean futures traded between $14.00 and $14.31. May/Jul and May/Nov future spreads were -5 and -140 cents. May 2021 soybean-to-corn price ratio was 2.43 at the end of the week. July 2021 soybean futures closed at $13.98, up 2 cents since last Friday.
Soybeans | May 21 | Change | Nov 21 | Change |
Price | $14.03 | $0.01 | $12.63 | $0.00 |
Support | $13.89 | $0.28 | $12.52 | $0.17 |
Resistance | $14.25 | -$0.51 | $12.81 | -$0.18 |
20 Day MA | $14.11 | -$0.03 | $12.38 | $0.06 |
50 Day MA | $14.00 | $0.07 | $12.16 | $0.15 |
100 Day MA | $13.30 | $0.17 | $11.56 | $0.15 |
4-Week High | $14.56 | -$0.04 | $12.85 | $0.00 |
4-Week Low | $13.64 | $0.00 | $11.84 | $0.00 |
Technical Trend | Down | = | Up | = |
In Tennessee, new crop cash soybean prices at elevators and barge points ranged from $12.59 to $13.01. November 2021 soybean futures closed at $12.63, unchanged since last Friday. Downside price protection could be achieved by purchasing a $12.80 November 2021 Put Option which would cost 86 cents and set an $11.94 futures floor. Nov/Dec 2021 soybean-to-corn price ratio was 2.55 at the end of the week.
Cotton
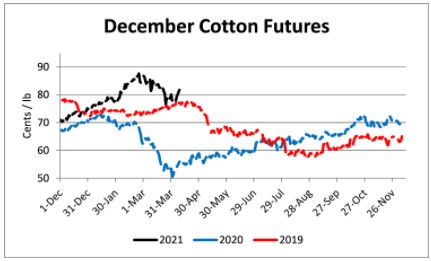
Net sales reported by exporters were up compared to last week with net sales of 269,900 bales for the 2020/21 marketing year and 49,000 bales for the 2021/22 marketing year. Exports for the same time period were up 15% compared to last week at 371,700 bales. Upland cotton export sales were 104% of the USDA estimated total annual exports for the 2020/21 marketing year (August 1 to July 31), compared to the previous 5-year average of 98%. Delta upland cotton spot price quotes for April 8 were 80.15 cents/lb (41-4-34) and 82.40 cents/lb (31-3-35). Adjusted world price decreased 0.67 cents to 64.92 cents. May 2021 cotton futures closed at 82.4, up 4.45 cents since last Friday. For the week, May 2021 cotton futures traded between 77.65 and 83.43 cents. May/Jul and May/Dec cotton futures spreads were 1.34 cents and -0.62 cents. July 2021 cotton futures closed at 83.74 cents, up 4.47 cents since last Friday.
Cotton | May 21 | Change | Dec 21 | Change |
Price | 82.40 | 4.45 | 81.78 | 3.87 |
Support | 80.21 | 4.91 | 80.33 | 4.59 |
Resistance | 84.53 | 1.69 | 82.73 | 1.25 |
20 Day MA | 82.38 | -1.68 | 80.76 | -0.92 |
50 Day MA | 85.44 | -0.28 | 82.30 | 0.14 |
100 Day MA | 81.27 | 0.41 | 78.02 | 0.52 |
4-Week High | 88.56 | -2.89 | 85.00 | -1.73 |
4-Week Low | 77.12 | 0.00 | 75.34 | 0.00 |
Technical Trend | Down | = | Down | = |
December 2021 cotton futures closed at 81.78 cents, up 3.87 cents since last Friday. Downside price protection could be obtained by purchasing an 82 cent December 2021 Put Option costing 6.93 cents establishing a 75.07 cent futures floor.
Wheat
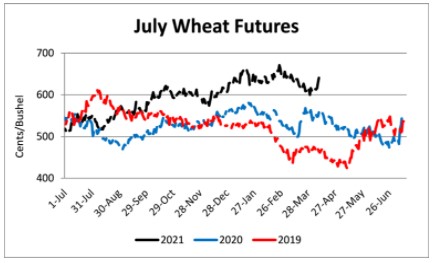
Wheat net sales reported by exporters were up compared to last week with net sales of 3.0 million bushels for the 2020/21 marketing year – a marketing year low-- and 19.5 million bushels for the 2021/22 marketing year. Exports for the same time period were up 23% from last week at 23.3 million bushels. Wheat export sales were 95% of the USDA estimated total annual exports for the 2020/21 marketing year (June 1 to May 31), compared to the previous 5-year average of 101%. In Tennessee, spot wheat prices ranged from $6.50 to $6.74. May 2021 wheat futures closed at $6.38, up 27 cents since last Friday. May 2021 wheat futures traded between $6.07 and $6.46 this week. May wheat-to-corn price ratio was 1.11. May/Jul and May/Sep future spreads were 2 and 3 cents.
Wheat | May 21 | Change | Jul 21 | Change |
Price | $6.38 | $0.27 | $6.40 | $0.30 |
Support | $6.18 | $0.30 | $6.18 | $0.28 |
Resistance | $6.56 | $0.19 | $6.56 | $0.23 |
20 Day MA | $6.25 | -$0.07 | $6.25 | $0.00 |
50 Day MA | $6.42 | -$0.04 | $6.42 | $0.07 |
100 Day MA | $6.32 | $0.01 | $6.32 | $0.09 |
4-Week High | $6.49 | -$0.19 | $6.49 | -$0.08 |
4-Week Low | $5.93 | $0.00 | $5.93 | $0.01 |
Technical Trend | Down | = | Up | + |
In Tennessee, new crop wheat cash contracts ranged from $6.00 to $6.74. July 2021 wheat futures closed at $6.40, up 30 cents since last Friday. Downside price protection could be obtained by purchasing a $6.45 July 2021 Put Option costing 15 cents establishing a $6.30 futures floor. September 2021 wheat futures closed at $6.41, up 29 cents since last Friday.
Source : tennessee.edu