By Dan Kaiser
One item I have been providing in our current corn and soybean fertilizer guidelines is estimated removal rates of phosphorus (P) and potassium (K). While our fertilizer guidelines have traditionally not been crop removal-based, growers using crop removal have told me that the concentration of P and K in grain has slightly declined compared to older values used for crop removal.
One thing you need to know about calculating removal-based rates is that the so-called rules of thumb for the amount of P and K in grain may or may not represent what you have in the field. One concern I have is that some growers treat their P and K like balancing a checkbook, trying to calculate what is taken off the field and putting that amount back on in fertilizer. In almost all cases, this type of accuracy is not needed for removal-based guidelines. Here is why:
1. The amount of P and K in grain can vary greatly
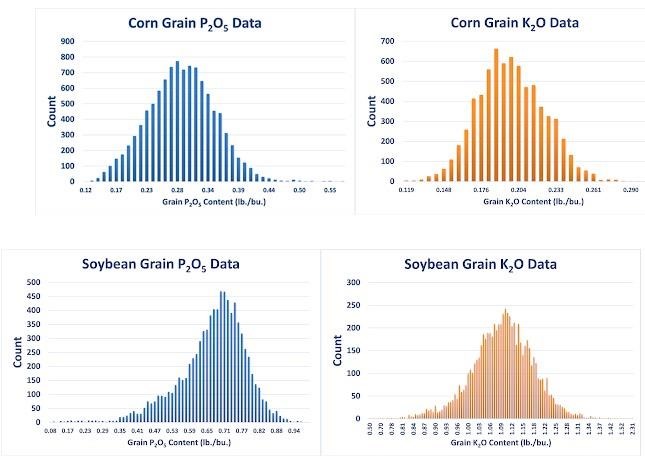
While rules of thumb or standard factors can provide a good starting point, the actual concentration of P and K in the grain you are removing cannot be known unless you grind a small amount of grain and have it analyzed. The graphs below show the actual range in values in my set of roughly 15,000 samples collected over the past 14 years. Tables in both the corn and soybean fertilizer guidelines for Minnesota list the median P and K removal values as well as the 25% and 75% confidence intervals. The confidence interval data indicates where we are confident the actual mean is. For example, a 200-bushel corn crop should remove anywhere from 50 to 66 lbs P2O5 and 36 to 44 lbs K2O on an annual basis. We tend to treat the removal values as an exact value when it is a range.
2. There is more P and K in the soil than is indicated by the soil test
If you are soil testing, it should be known that the amount of P or K extracted by the soil test is only a small fraction of the total amount of each nutrient in the soil. Total phosphorous concentration, for example, may be 100 times higher than what is extracted by the soil test procedure used but not all is available and the only way to really know how much P or K are available is taking a soil test. Both P and K exist in the soil in various “pools” that vary in plant availability. As one pool is increased or decreased, it affects the remaining pools, either increasing or decreasing the amount of P or K contained in each pool. This means that P and K availability in the soil is dynamic over time and the checkbook approach to calculating fertilizer needs is far more stringent than is needed to manage the nutrients. In most cases, being close is good enough.
3. The rate that soil tests change can be unpredictable
Some people seem to think that if no or low rates of nutrients are applied, soil test values will crash. While it is true that if you apply nothing, soil test values will decrease over time, the rate at which they decrease depends on factors such as the soil test concentration when fertilizer application is stopped, crop rotation, and potentially tillage. In most cases, we have seen that applying exactly the amount of P or K removed will lead to a small increase in soil test values over time and that we can maintain soil test value in the top six inches by applying a fraction of what is removed.
4. The probability that fertilizer will increase yield decreases with increasing soil test values
Soil test categories can be thought of as representing the ability of the soil to supply all of the given nutrients for a crop. As soil test values increase, the ability of the soil to supply all nutrients to the crops increases until a point that the fertilizer applied is primarily replacing what is taken up from the soil by the crop. If you are looking at risk assessment, there is data available as to the probability that fertilizer will increase crop yield using the current soil test classifications in Minnesota and an estimated percentage of yield that should be produced if fertilizer is not applied. This data is only available right now for phosphorus in Minnesota as the potassium data has been much more variable and harder to predict.
5. It is a good time to take soil samples if you have not done so for a while
It seems like some producers have started to hit the easy button and blindly apply P and K based on removal without knowing what their current soil test values are. One area of concern I have is building soil tests too high. While we do not think of soluble phosphorus being an issue in fields as soil tests increase, the risk for P loss to tile lines will increase. There is no agronomic reason to build soil tests too high, so knowing where you are and adjusting rates down can reduce P loss to the environment without sacrificing yield. Many treat their soil like a bank for nutrients, but this bank can be a bit leaky over time should the concentration of some nutrients get too high.
In closing, I want to reiterate that there is no way to apply exactly the amount of nutrients removed on an annual basis from fields. Being close is typically sufficient and you will not find that soil test values decrease if your application rates of P and K and what was removed by the crop are within plus-or-minus 10 to 15 lbs. Soil testing is critical to look at trends in your fields, providing you with important insights on your management practices.
Source : umn.edu