By Gary Schnitkey and Jim Baltz et.al
Department of Agricultural and Consumer Economics
University of Illinois
Carl Zulauf
Department of Agricultural, Environmental and Development Economics
Ohio State University
Some farmers have asked about using crop insurance on soybeans, indicating that they have not received crop insurance payments in a very long time and wondering if purchasing crop insurance is a reasonable investment. Herein, we examine the crop insurance performance for soybeans, finding that soybean policies pay relatively less than all policies in the U.S. Payments relative to premiums are much lower in northern and central Illinois than the U.S. in general. Even given low payments, reducing crop insurance coverage has risks, particularly given the high production costs this year. We discuss some crop insurance strategies which some farmers may use with soybeans.
Soybean Loss Ratios Over Time
Soybeans have low loss ratios over time. A loss ratio equals payments over total premiums, with a loss ratio of 1.00, meaning that payments equal premiums. A loss ratio above 1.00 means that payments exceed premiums. Conversely, a loss ratio below 1.00 means the total premiums are higher than payments. The Risk Management Agency (RMA) is the U.S. Department of Agriculture agency that administers crop insurance and has a legislative goal of maintaining a loss ratio for the entire program of 1.00 over time. A loss reserve is built during the setting of the premium, resulting in a target loss ratio for the program that should be below 1.00.
Over the twenty-year period from 2002 to 2021, the loss ratio for the entire program averaged .82 (see Figure 1). In all but four years, the loss ratio for all policies administered by the RMA was below 1.00: 2002 when the ratio was 1.39, 2012 with 1.57, 2013 with 1.02, and 2019 with 1.05 (see Figure 1). When evaluated across all policies and crops, RMA is meeting its legislative goal.
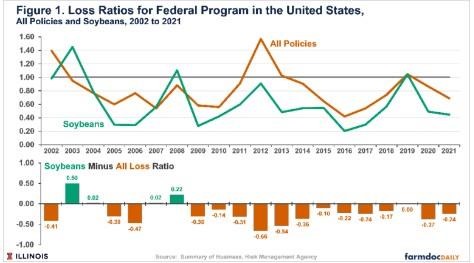
The loss ratio for soybean policies in the U.S. averaged .62 from 2002 to 2021, well below the .82 loss ratio for the entire program. In all but four years, the loss ratio for soybeans was below the loss ratio for the U.S. program:
- 2003: soybean loss ratio of 1.45 and U.S. ratio of .95.
- 2004: soybean loss ratio of .78 and U.S. ratio of .76.
- 2007: soybean loss ratio of .56 and U.S. ratio of .54.
- 2008: soybean loss ratio of 1.10 and U.S. ratio of .88
Overall, the soybean loss ratio is consistently below the loss ratio for all policies in the U.S.
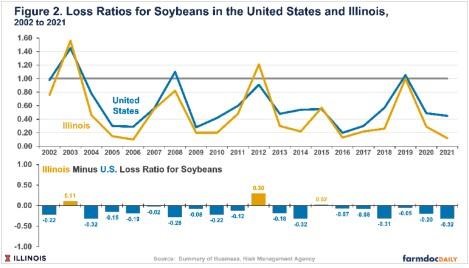
Soybeans in Illinois have even lower loss ratios than in the U.S. (see Figure 2). Between 2002 and 2021, Illinois’ loss ratio for soybeans averaged .48, well below the .65 average for the U.S. Illinois’ loss ratio for soybeans has been below the U.S. loss ratio in all but three years:
- 2003: 1.56 for Illinois compared to 1.45 for the U.S.
- 2012: 1.21 for Illinois compared to .91 for the U.S.
- 2015: .57 for Illinois compared to .55 for the U.S.
Within Illinois, loss ratios are the lowest in central Illinois, followed by northern Illinois, and then by southern Illinois (see Figure 3). The county with the lowest average loss ratio from 2002 to 2021 is Christian County (central Illinois), with a .17 loss ratio. Warren County (west-central Illinois) has the second lowest loss ratio at .19. Many counties in central Illinois have loss ratios below .30.
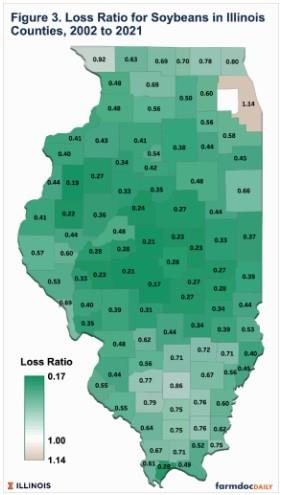
Loss ratios in southern Illinois tend to be higher. In southern Illinois, Jefferson County has the highest loss ratio at .86. Note that Jefferson County is not excessively high but nearer the 1.00 legislated target when compared to many other counties in Illinois.
Crop Insurance Decisions with Low Loss Ratios
Low loss ratios over time indicate that premiums are too high relative to payments. Farmers do not pay all the premiums associated with the total premiums as the Federal government provides premium support. Even given this premium support, farmers in some counties have paid more into crop insurance than have been received in indemnity payments over time. For example, in Christian County — the county with the lowest soybean loss ratio in Illinois — farmers have, on average, paid $5.32 per acre more in premiums than have been received in payments in each year from 2002 to 2021.
It seems extremely risky to eliminate crop insurance on soybeans. Costs have increased greatly, and there is the risk of downside price movements. Well over 90% of the acres in Illinois are insured using Revenue Protection (RP), and most farmers use relatively high coverage levels (see farmdoc daily, November 17, 2020 and January 25, 2022). In northern and central Illinois, most farmers purchase crop insurance at the 80 and 85% coverage levels, while southern Illinois farmers typically use 75% and 80% coverage levels. Below we offer and discuss two insurance strategies to consider.
Lower Coverage Level and Use SCO and ECO: Table 1 shows crop insurance premiums for RP at different coverage levels in Christian County. These premiums are for enterprise units. An 85% coverage level has a farmer-paid premium of $15.25 per acre. Lowering the coverage level to 80% will cut the farmer-paid premium in half to $6.62 per acre.
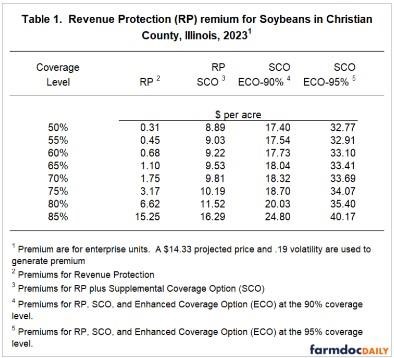
A farmer could also add the Supplemental Coverage Option (SCO) to their lower individual coverage level (see farmdoc daily, February 27, 2014). SCO provides county coverage from 86% to the level of the underlying RP product. For an 80% RP product, SCO provides coverage from 86% to 80%. SCO coverage uses county yields, and county yields may not match farm yields, presenting cases in which a farm-level product would pay and SCO would not, and vice versa. An 80% RP plus an SCO product has an $11.52 total premium, still below the $15.25 premium for 85% RP. Further reductions in the RP coverage level reduce the premium on the combined RP and SCO product (see Table 1).
Farmers could also add an Enhanced Coverage Option (ECO) policy on top of SCO (see farmdoc daily, November 24, 2020). ECO with a 90% coverage level will protect 90% to 86%, enhancing the coverage above the 86% level on SCO. However, ECO will increase the farmer-paid premium cost. For example, a combination of 80% RP, SCO, and ECO at the 90% coverage level has a premium of $20.03 per acre, higher than the $15.25 premium for RP-85%.
In Christian County, SCO was purchased on 3,806 acres or 2.8% of eligible RP acres in 2022. ECO was used on 2,580 acres. More detail on ECO and SCO use is provided in farmdoc daily articles on August 9, 2022, and January 31, 2020.
More detail on strategies using RP, SCO, and ECO is provided in the March 2, 2021, farmdoc daily.
Use RP with the Harvest Price Exclusion
Farmers could also use RP with the Harvest Price Exclusion (RPhpe). RPhpe does not have a guarantee increase like RP. RP uses the higher of the projected and harvest price in setting its guarantee, while RPhpe uses only the projected price. Having the guarantee increase is particularly useful in drought years when yields are low, and prices are high. In 2012, the guarantee increase had a large impact on crop insurance payments from corn. However, the impact was less for soybeans (see Table 2).
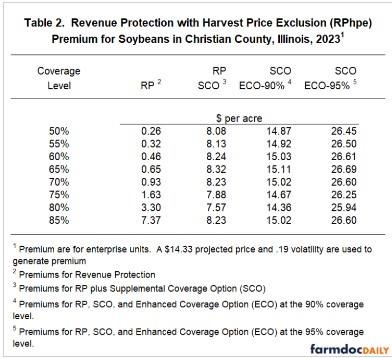
RPhpe 85% has a $7.37 premium, half the premium for RP 85%. Farmers could add SCO and ECO-90% and have a combined premium of $15.02, still less than the RP 85% coverage level. The use of RPhpe plus ECO would benefit those farmers more concerned with price declines as the SCO and ECO would increase the coverage level, although using a county-based coverage band from 90% down to the individual plan’s coverage level.
Summary
Loss ratios for soybeans are lower than other Federal policies, and loss ratios are particularly low in northern and central Illinois. In an effort to reduce premiums while maintaining some safety net, some farmers may lower coverage levels on RP and make up some of the difference with SCO. Doing so will trade farm yield coverage for county coverage. If a farm’s yields are low, reducing coverage level may result in lower or no crop insurance payment. The use of RPhpe rather than RP also will lower the premium substantially. Using RPhpe gives up the guarantee increase which is included in RP. The guarantee increase is most useful in drought years like 2012. Any strategy to reduce insurance premium costs has tradeoffs that should be considered.
Source : illinois.edu