By Tim Beck
Dairy financial performance improved during 2020 compared to previous years, but 2021 was less profitable than 2020. This is not surprising given the increase in feed costs and the lower amount of government payments in 2021. Farms received an average of $231/cow in government payments in 2021 compared to $696/cow in 2020. During 2021, farms included in the Extension Dairy Team's data had an average -$7/cow Net Return over Labor and Management. This was down from a $72 average profit per cow in 2020. Cost of production also increased with an average of $18.61/cwt in 2021 compared to $17.96/cwt. in 2020. There was a wide range of differences within the group with the lowest cost of production at $14.59/cwt., and the highest cost at $24.28/cwt. The range in profitability was just as striking with the highest profit farm having a $985 profit/cow while the lowest profit farm lost $1,303 per cow. Milk production dipped slightly in 2021 to 25,264 lbs. sold per cow compared to 25,702 lbs. sold per cow in 2020.

Table 1 illustrates key differences between the 32 high and low profit farms in the 2021 data set. As in 2020, the high 20% profit farms did not market the most milk per cow. Generally, higher milk income translates into higher profit and a lower cost of production. This reinforces the concept that having a balance of input costs and expenses is critically important to earning a profit. Expenses that don't increase income on the farm should be carefully considered. Purchased feed was an important issue for the 2021 farms and will likely be even more important in 2022. Over the last five years, farms averaged $2,383/cow in total feed costs. These costs include purchased feed and the value of home-raised feed at cost for all animal groups on the farm. In 2021, farms had the highest feed cost of the last 5 years with an average of $2,607/cow compared to the $2,383/cow average. This $224/cow increase over the five-year average may increase to $300-$400/cow during 2022 based on recent cash flow projections for farms.
Table 1. Dairy Cow and Heifer Enterprise, Farms sorted by Net Return over Labor and Management, 2021
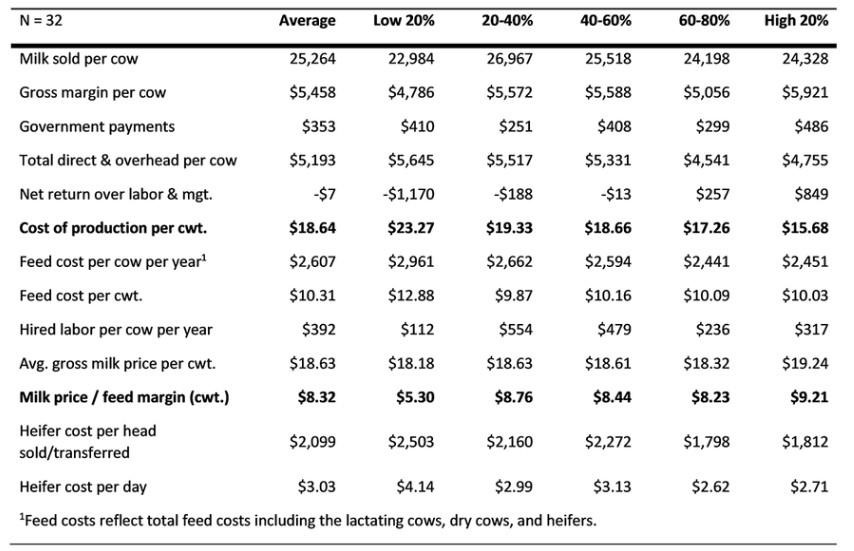
The top 40% of farms had lower labor costs at $317 and $236/cow than the moderate 40% in the middle at $479 and $554/cow. While the low profit 20% had the lowest hired labor cost at $112/cow, milk sold per cow for this group was significantly below average at 22,984/cow. The lower feed and hired labor costs were also reflected in a lower cost to produce heifers. The high profit group spent $1,812/head sold or transferred while the low 20% group had a cost of $2,503/head. Sold or transferred refers to the way heifer costs are analyzed in this method. Heifer calves are "transferred" to the heifer enterprise when born and are later "transferred" back to the milking cow enterprise when freshened. Heifers sold for cash instead of staying in the herd are also counted in this total head sold or transferred. While all farms had an average cost of production including labor and management of $18.63/cwt, the high profit group had a cost of $15.68/cwt.
Comparing 2021 to previous years in Table 2, the numbers across the board are slightly less favorable than in 2020. The farms sold slightly less milk in 2021, with a gross margin of $5,458/cow compared to 2020's $5,609/cow average. In addition, the range in 2021 feed cost between the high and low profit groups was $510/cow/year. This reinforces the need to use as much home-raised feed as possible to reduce total feed cost. The most profitable group spent $1,485/cow on purchased concentrates, while the least profitable group spent $1,808/cow. The farms with lower purchased feed costs often have a better fit of cows to the amount of crop acreage they utilize. This results in less purchased grains and forages to feed their herds.
Table 2. Dairy Cow and Heifer Enterprise, Farms sorted by Year, 2017-21
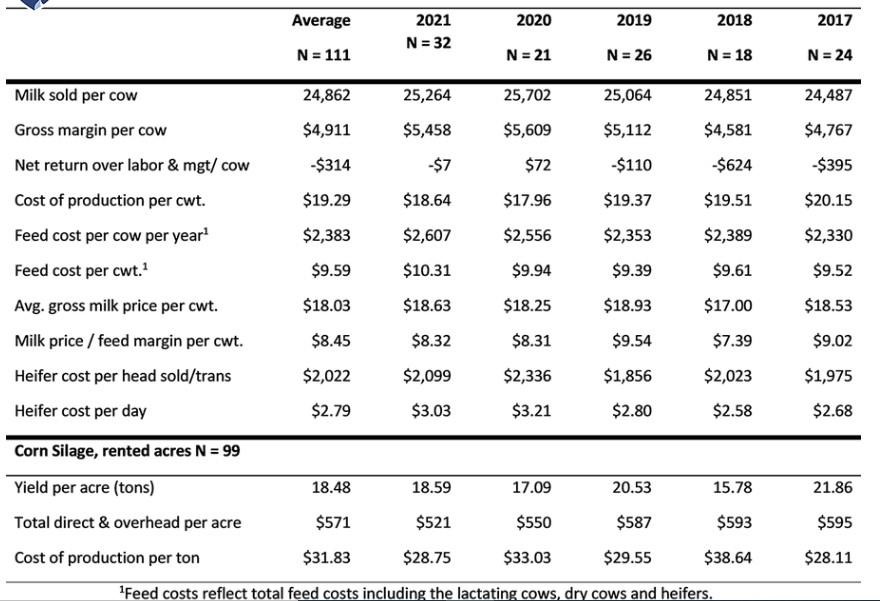
Corn silage production cost was lower at $28.75/ton in 2021 compared to an average of $31.83/ton over all years. Yield per acre was higher in 2021 at 18.59 tons/acre average compared to the 18.48 tons/acre for the multiple year average. Yield is a very important issue in the cost per unit for forage and grain crops.
Table 3 provides some data to objectively compare the whole farm financial health for each year. Farms made some financial progress on paying off outstanding bills, lines-of-credit, and other current debt during 2020 and 2021. The current ratio remained essentially the same at 2.57 compared to the previous year's 2.56. This suggests most farms in the group were able to stay current with bill paying in 2021.
Table 3. Financial Standards Measures, Farms sorted by Year, 2016-20
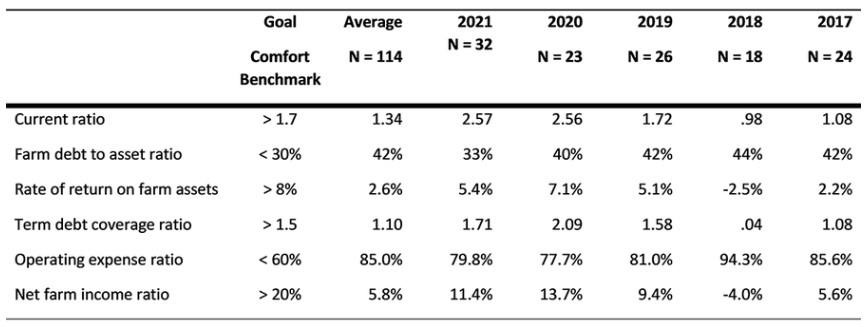
While producers often comment that farms are exiting due to a heavy debt load, the solvency issue was improved slightly in 2021 compared to previous years. Farms averaged 42% debt to asset ratio over the five years with a 33% average in 2021. Lenders suggest keeping loan payments of principal and interest less than $750/cow/year. This modest improvement in debt to asset ratio was likely due to a reduction of short-term current debt and accounts payable made possible by government payments including risk management tools like Dairy Margin Coverage and Dairy Revenue Protection the last two years.
Rate of return on assets declined to 5.4% in 2021 compared to the high of 7.1% in 2020. This was a significant improvement over the 2.6% five-year average. The Term Debt Coverage of 1.71 was lower than the 2.09 recorded in 2020 but is still well above the 1.25 standard required by many lenders. Stronger profitability provides more money to pay principal and provide owner draw.
Profitability drives all the other financial ratios and is essential for farms to make financial progress. The Operating Expense ratio is an excellent measure of the efficiency of converting farm expenses to sales. This ratio slipped slightly in 2021 to 79.8% compared to the 77.7% shown in 2020. That means 79.8 cents of every dollar went to pay operating expenses before paying for interest and depreciation. This does not meet the recommended benchmark of <60%, however experience suggests dairy farms should try to achieve a 70% ratio as a starting goal and then work to improve this ratio over time. The milk price received in 2021 at $18.63/cwt. average was higher than the previous year, so milk price did not adversely affect this ratio, but the combination of higher feed costs and lower milk pounds sold moved this measure in the wrong direction.
The farms had 11.4% Net Farm Income available for profit after taking out the amount for Operating Expenses, Interest and Depreciation. That is well below the goal of greater than 20%, but it is a step in the right direction compared to the 5.8% multiple year average.
While 2021 was not as strong in financial performance compared to 2020, it still showed improvement over the multiple year averages in nearly every area. The most fundamental problem remains keeping a profitable margin per Cwt. in the face of rising feed and other input costs. The average margin of $8.32/cwt across all groups was nearly unchanged comparing 2021 to 2020.
Producers should continue to focus on high milk production balanced against costs that are appropriate for the revenue generated.
Source : psu.edu