By Gary Schnitkey, Krista Swanson et.al
Department of Agricultural and Consumer Economics
University of Illinois
By Carl Zulauf
Department of Agricultural, Environmental and Development Economics
Ohio State University
The impact of COVD-19 on cash prices for the 2019 through 2021 marketing years is estimated. These pre and post COVID-19 cash price projections, with revisions as warranted, will serve as a foundation to more formally access the damage done by the coronavirus on farm incomes in future articles. These price estimates will be useful in accessing the degree to which recently enacted and any forthcoming policy responses aid farmers. Price estimates in this paper will also be used to begin to access the impacts of COVID-19 on management adjustments needed for 2021, for example setting of cash rents for the 2021 production year. Post-COVID prices presented here likely will be revised as more information becomes available.
Market Year Average (MYA) Price Estimates
Table 1 shows estimates of 2019 through 2021 market year average (MYA) prices for corn and soybeans, pre and post COVID-19. These estimates are for marketing years, which runs from September through August for both corn and soybeans. The 2019 MYA prices then are for the months from September 2019 through August 2020. These are national, cash prices, and are the same prices used to determine commodity title payments.
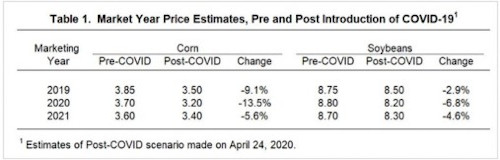
The pre-COVID scenario will be represented by prices in February, before the full social distancing measures for COVID-19 were publicly contemplated. For corn, the pre-COVID prices are $3.85 per bushel for the 2019 marketing year, $3.70 for 2020, and $3.60 for 2021. The 2019 and 2020 MYA prices are the same as those released in a February 21, 2020 Grain and Oilseeds Outlook paper that was made available at the 2020 Agricultural Outlook Forum. The 2021 MYA price is based on a $3.40 estimate contained in USDA long-run projections, adjusted up because the Grain and Oilseeds Outlook contained more optimistic estimates of price. For soybeans, the pre-COVID prices are $8.75 for the 2019 marketing year, $8.80 for 2020, and $8.70 for 2021. Similar to corn, the 2019 and 2020 MYA prices come from the February 21, 2020 Grain and Oilseeds Outlook paper. Similar to corn, adjustments were made to the 2021 price in UDA long-run projections.
For corn, the post-COVID prices are $3.50 per bushel for 2019, $3.20 for 2020, and $3.40 for 2021. These prices are down from pre-COVID estimates by 9.1% in 2019, 13.5% for 2020, and 5.6% in 2021. These prices are roughly consistent with a major recession occurring because of COVID-19 control measures, resulting in losses in corn demand from ethanol and reduced demand for corn in livestock feeds, leading to much lower corn prices in 2020. For 2021, the price decline from the pre-COVID price is lower, with the assumption the U.S. economy begins to recover.
For soybeans, the post-COVID prices are $8.50 per bushel for 2019, $8.20 for 2020, and $8.30 for 2021. Post-COVID prices follow the same trajectory as corn, with the largest negative declines occurring in 2020. The relative price declines for soybeans are smaller than for corn. Corn has experienced a stronger reaction to COVID-19 measures because of the large corn use in producing ethanol and current challenges in that industry (see farmdoc daily, April 27, 2020 and April 8, 2020). Corn’s other major use, livestock feed, is facing downward pressure as the meat processing sector slows livestock processing to protect workers. Moreover, the upcoming recession, likely major, will have continuing negative impacts on corn use in ethanol and livestock feeds.
The estimates in Table 1 should be viewed as expectations, dependent on outcomes of many production and economic factors. In particular, 2020 production will have large impacts on 2020 prices. The trend yield used in USDA projections is 178 bushels per acre. Rather than a $3.20 MYA price for 2020, a 2020 national yield that is above-trend like those in 2017 and 2018 would result in a MYA price much closer to $3.00 per bushel.
Background for the post-COVID prices are provided in the following sections. The first section discusses 2019 MYA prices while the second discusses 2020 and 2021 prices.
Projections of 2019 Market Year Average Prices
The 2019 marketing years were half over before COVID-19 measures were introduced. According to USDA statistics, 40% of the corn is marketed from March to the end of marketing year in August. Twenty-five percent of the soybeans are marketed from March to the end of the year. As a result, declines in a market year average prices occur because of reductions in cash prices in the remaining months of the marketing year. Impacts of COVID-19 on 2019 will be somewhat muted because marketing years were already well underway.
Estimates of MYA prices are released monthly in the World Agricultural Supply and Demand Estimates (WASDE) report. Table 2 shows a history of these 2019 projections since May 2019. Major crops contained in the WASDE Report are included in Table 2. In its May 2019 report, the 2019 MYA price was $3.30 per bushel for corn. As wet weather and the attendant planting issues unfolded, estimates of U.S. production declined, resulting in increasing estimates of 2019 MYA prices. By February, 2019 MYA estimates were $3.85 per bushel for corn, $8.75 per bushel for soybeans, and $4.55 for wheat. February is taken as the point used to estimate pre-COVID prices.
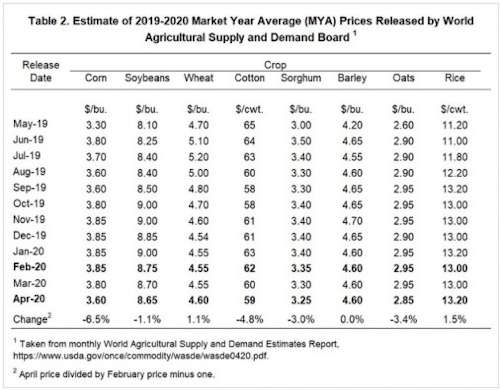
Since February, cash prices for many crops have declined, leading to revised 2019 MYA prices in WASDE reports. In April, WASDE estimates of MYA prices were:
- $3.60 per bushel for corn, a decline of 6.5% from the $3.85 price,
- $8.65 per bushel for soybeans, a decline of 1.1% from the $8.75 price,
- $4.60 per bushel for wheat, an increase of 1.1% from the February price of $4.55,
- $59 per cwt for cotton, a decline of 4.8% from the February price of $62 per cwt,
- $3.25 per bushel for sorghum, a decline of 3.0% from the February price of $3.35,
- $4.60 per bushel for barley, the same as the February price,
- $2.85 per bushel for oats, a decline of 3.4% for the February price of $2.95 per bushel, and
- $13.20 per cwt for rice, an increase of 1.5% from the $13 per cwt February price.
Obviously, prices have declined for some crops since COVID-19 measures have been introduction.
The declines projected in WASDE are corroborated by models produced by the Economic Research Service (ERS), an agency of the U.S. Department of Agriculture. The ERS publishes Microsoft Excel spreadsheets for estimating MYA prices for corn, soybeans, wheat, and cotton (click here for spreadsheets, https://www.ers.usda.gov/data-products/season-average-price-forecasts/). These spreadsheets use actual prices for months that NASS has published that data. For remaining months in the marketing year, settlement prices on futures contracts are used to estimate monthly prices. Monthly marketing weights are used to calculate a weighted average of monthly prices to give an estimate of the MYA price.
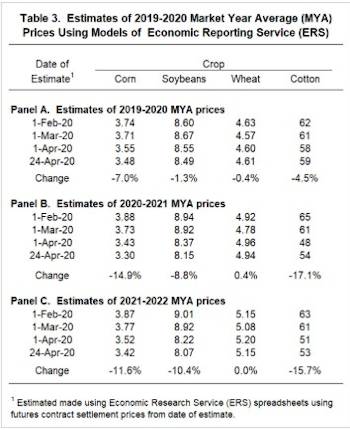
Panel A of Table 3 shows projections of 2019 MYA prices made on February 1, March 1, April 1, and April 24. On February 1, ERS models indicated a 2019 MYA price of $3.74 per bushel for corn. On April 24, the 2019 MYA price was estimated at $3.48, a decline of 7.0% from the February price. For the 2019 MYA year, ERS models suggest changes of -1.3% for soybeans, -.4% for wheat, and -4.5% for cotton.
Percentage declines from the ERS models are consistent with those published in WASDE reports. For corn, ERS models suggest larger declines than produced in WASDE reports. Cash and futures prices for corn have been on a steady declining trajectory since the beginning of March that has not stabilized. Soybean, wheat, and cotton prices have shown more resilience than corn at this point. The full market impacts of COVID-19 on corn may not be felt at this point.
Based on the above analysis, we use a $3.50 MYA price estimate for corn in 2019, a decline of 9.1%. This is consistent with the expectation for continuing pressure on corn prices throughout the remainder of the marketing year. A $8.50 post-COVID price will be used for soybeans, down by 2.9% from the $8.75 pre-COVID price.
Projections are for 2019 and 2020
ERS models were also used to project MYA prices for 2020 (see Panel B of Table 3) and 2021 (see Panel C of Table 3). These estimates rely totally on futures prices to arrive at MYA price estimates. In essence, the models provide weighting for price on futures contracts, and adjust futures prices by basis to arrive at cash prices.
For corn, the 2020 MYA price was estimated at $3.88 using information on February 1, and $3.30 on April 24, a decline of 14.9%. Soybeans were estimated to decline from $8.94 on February 1 to $8.15 on April 24, a decline of 8.8%. Using future prices, wheat prices are projected to increase .4% from $4.92 on February 1 to $4.94 on April 24. Cotton prices are projected to decline 17.1%, from $65 per cwt on February 1 to $54 on April 24.
FAPRI also has estimated price declines as a result of COVID-19 (here). FAPRI’s estimates for the 2020 MYA are:
- Corn: -9.4% from $3.70 per bushel pre-COVID to $3.35 post-COVID,
- Soybeans: -6.5% from $8.85 per bushel pre-COVID to $8.27 post-COVID,
- Wheat: -5.4% from $4.84 per bushel pre-COVID to $4.58 post-COVID, and
- Cotton: -10.0% from $61.7 per cwt pre-COVID to $55.5 post-COVID.
The major difference between futures models and FAPRI projections come in wheat, with FAPRI showing a decline and future models showing an increase. FAPRI models likely are attempting to isolate the impacts of COVID-19, which generally would be viewed as not being positive, while future models are based on market expectations, which include many factors in their formation.
Both futures and FAPRI models show major impacts on 2020 MYA prices, which are larger than 2019 MYA prices. The 2019 marketing year was already well underway, with many sales made prior to price declines, leading to muted responses on 2019 MYA prices. Furthermore, the impacts of COVID-19 are just beginning to be felt. A major recession will continue to reduce demand for fuel and ethanol, as well as for feed in livestock.
Futures market estimates for 2021 MYA prices decreased from February 1 to April 24, but less so than for 2020 (see Panel C of Table 2). Trading in these outside months are limited and additional unknowns farther into the future, so estimates should be based with some skepticism. Still, it seems reasonable to expect COVID-19 impacts to linger through the 2021 marketing year. The estimates of price declines in Table 1 are less than those from future markets, based on the assumption of a recovery in the U.S. and world economy.
Commentary
The prices presented in Table 1 provide initial estimates of the impacts that COVID-19 has had on price expectations for corn and soybeans. These prices likely will be revised in the future as more information becomes available to access the impacts on COVID-19 on crop farm economics.
These price expectations seem reasonable for COVID-19 impacts. They are not a worst case scenario. A major recession, followed by a recovery is built into the price estimates for the time span the three marketing years cover. Given that social distancing measures have not been implemented before, no data exists to access the depth of recession, or the resulting recovery. We choose here to believe in a robust US economy, leading to recovery. A much larger and lengthy recession in the US or around the world would cause estimates to be worse than presented here. Conversely, a more buoyant recovery would result in higher prices than presented here.
Finally, the prices presented here reflect expectations, particularly for the 2020 and 2021 marketing years. The 2020 MYA prices are made with the assumption of close to trend yields in the U.S. Yields above trend could lead to substantially lower prices, and vice versa.
Source : illinois.edu