By Jonathan Coppess
Department of Agricultural and Consumer Economics
University of Illinois
Christopher Navarro, Vara Veera Gowtham Naraharisetty, Sandeep Puthanveetil Satheesan,
National Center for Supercomputing Applications
University of Illinois
Rabin Bhattarai, Rishabh Gupta
Department of Agricultural and Biological Engineering
University of Illinois
Shalamar Armstrong
Department of Agronomy
Purdue University
Trent Ford
Illinois State Climatologist
Illinois State Water Survey, Prairie Research Institute
The Gardner Agriculture Policy Program, farmdoc and the National Center for Supercomputing Applications (NCSA) announce further updates to the Cover Crop Decision Support Tool introduced last October (farmdoc daily, October 1, 2020; February 4, 2021). This first-of-its-kind web tool to help Illinois farmers manage cover crops in their fields has been generously funded by the Illinois Nutrient Research & Education Council (NREC) and the Walton Family Foundation. The tool can be accessed for free at: https://covercrop.ncsa.illinois.edu/. This release updates the tool in two critical ways: (1) provides improved weather forecasting, especially for the critical spring season; and (2) improved estimates of Nitrogen loss reduction. Both updates are discussed in detail.
Improved Weather Forecasting
Farmers know and understand that weather matters; timely information on precipitation and temperature at 2 to 12-week lead times can significantly improve crop management, conservation, and economic outcomes. Decisions made regarding spring season cover crop management are informed by weather and climate processes that operate in what is referred to as the subseasonal-to-seasonal (S2S) range. With this release, the Cover Crop Analyzer tool has integrated an ensemble of medium-range weather forecasts using data produced by the National Oceanic and Atmospheric Administration’s (NOAA) Subseasonal Experiment (SubX). The tool uses SubX forecasts for improved cover crop decision outlooks. Each week, the latest 30-day forecast will be retrieved and used when running the DSSAT crop model.
The S2S timescale represents a transition from deterministic weather forecasts to probabilistic climate forecasts (Ford et al., 2018), and recent efforts have been focused on improving precipitation and temperature forecasts at S2S timescales (Hao et al., 2014; Vitart and Robertson, 2018). These efforts include the development of multi-model S2S forecast systems, such as the NOAA Subseasonal Experiment (SubX, Pegion et al., 2019). SubX is a research-to-operations project that is focused on improving real-time subseasonal prediction using a multimodel ensemble approach and possesses significant advantages (Pegion et al. 2019). For example, SubX makes available forecasts from several state-of-the-art models, providing real-time, operational temperature and precipitation forecasts at S2S timescales critical for cover crop management and decision making in late winter and early spring.
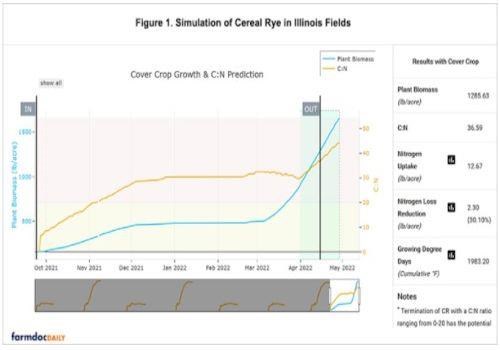
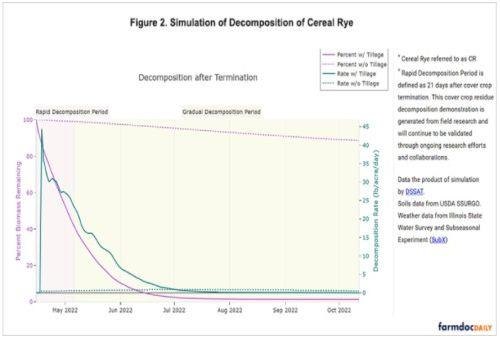
In addition, the Cover Crop Analyzer tool continues to use historical (30+ years) observations at numerous weather stations around the state to place the SubX precipitation and temperature forecasts in historical context. The tool is now computing percentiles of 2-, 4-, and 8-week total precipitation and average temperature based on the historical observations, and therefore provides a recurrence interval estimate (e.g., 1 in 10-year) for the SubX-forecasted conditions for the upcoming late winter and early spring. This additional weather information should significantly improve users’ cover crop management capabilities. Figures 1 and 2 are screen shots of a test run of the tool in a randomly-selected Illinois field.
Improved Estimates of Nitrogen Loss Reduction
As previously discussed, widespread adoption of cover cropping practices in Illinois corn and soybean fields is a critical component of the Illinois Nutrient Loss Reduction Strategy (farmdoc daily, February 4, 2021). Incorporating cover crops in the fallow period of the cash crop cycle—established around harvest of one cash crop and terminated around planting of the next cash crop—is well understood to increase soil organic carbon and reduce nitrogen losses through subsurface tile drainage (Nevins, Nakatsu and Armstrong 2018; Nevins, Lacey and Armstrong 2020). Continued work on the tool, as well as feedback from users and researchers, raised questions about the DSSAT outputs for nitrogen loss reduction. As a result, the updated tool includes modifications for tile drained fields. Specifically, the default SSURGO soil properties have been modified using soil calibration done by the development team to improve the modeling of expected Nitrogen loss reduction.
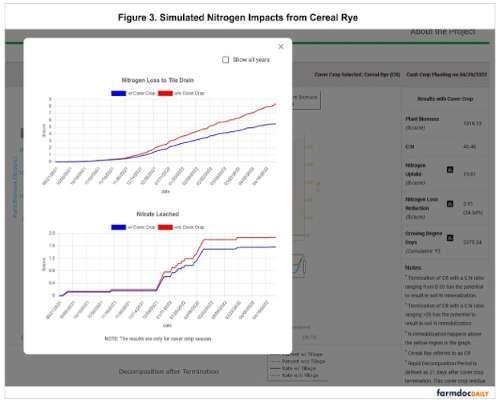
Several researchers reported that cover crop practices likely alter some soil properties, such as increased saturated soil water content, field capacity, organic carbon content, and decreased bulk density of the soil affecting the tile drainage volume and nitrate loss via tile drains (Basche & DeLonge, 2017; Rorick & Kladivko, 2017). However, there is no consensus on the exact percentage by which these properties change due to a cereal rye cover crop. The soil parameters in the DSSAT model for SLDR (drainage rate fraction) and SADC (anion adsorption coefficient, for reduced anion (nitrate) flow in variable-charge soil) were found to have a direct linkage in impacting the tile drainage volume and nitrate loss via tile drains, respectively. Therefore, to improve the model performance in capturing estimated cereal rye-induced impacts on the soil, these parameters were slightly modified in the updated tool. The model outcomes from these changes were analyzed further and compared to the results reported by Ruffatti, Roth, Lacey, & Armstrong (2019). Initial conclusions are that the changes improved the model and tool performance, better simulating the tile drainage flow and tile nitrate loss. Figure 3 is a screenshot from a recent run of the tool in an Illinois field, highlighting the simulated impacts for nitrogen loss to the tile drain and nitrate leached, with and without a cereal rye cover crop.
Other Improvements and Features
In addition to the two main features discussed above, this latest update includes other fixes and improvements. The DSSAT crop model has been updated to the latest version. The MyFarm page, dashboard graphs and visualized information have been improved based on user feedback. We’ve added default data for the 2021 crop season and users can now select default data for tile drained or non-tile drained fields. Finally, we’ve also fixed a few bugs in the tool for entering field coordinates and associating the right common land unit with the field, as well as for changes to planting, harvest or tillage if the user also added a fertilizer entry before saving the previous changes in MyFarm.
Source : illinois.edu