By Dan Undersander
Introduction
Relative Feed Value has been widely used for ranking forage for sale, inventorying and allocating forage lots to animal groups according to their quality needs, as well as determining when to harvest. With the introduction of the new approaches to determining animal requirements in National Research Council Nutrient Requirements for Dairy Cattle (2001), there is an opportunity to improve upon this quality index through use of newer analyses and equations.
Background
Relative Feed Value was based on the concept of digestible dry matter intake relative to a standard forage according to the following:
RFV = (DMI, % of BW) × (DDM, % of DM) ÷ 1.29
Where:
DMI = dry matter intake
DDM = digestible dry matter
Dry matter intake was estimated from NDF and DDM from acid detergent fiber. The constant, 1.29, was chosen so that RFV = 100 for full bloom alfalfa. The constant was the expected digestible dry matter intake, as % of BW, for full-bloom alfalfa based on animal data.
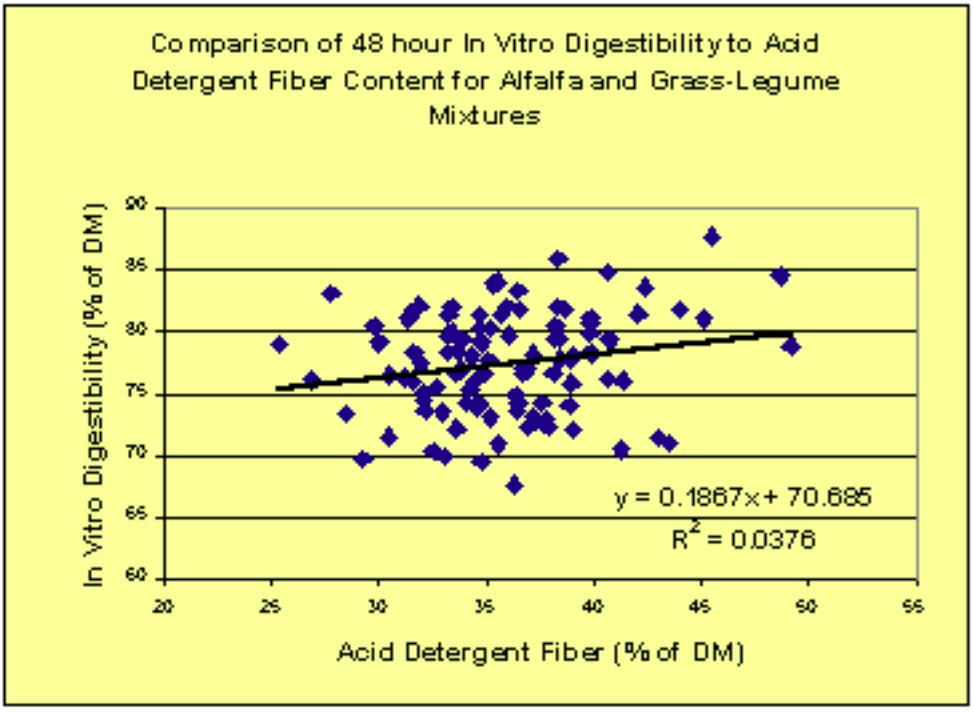
The problem with this approach is that it assumes that acid detergent fiber (ADF) has a constant relationship to digestibility since digestibility is calculated from ADF. There is considerable variation in the digestibility of the dry matter relative to the ADF content as shown in the graph. The new NRC Nutrient Requirements of Dairy Animals Cattle recognizes this and recommends the use of digestible fiber. Relative Forage Quality was developed to take advantage of the advance in technology.
How is RFQ calculated?
We propose to keep the same concept and format for Relative Forage Quality (RFQ) except that TDN will be used rather than DDM. Further, TDN and intake will be calculated using in vitro estimates of digestible fiber. Thus RFQ will be as follows:
RFQ = (DMI, % of BW) × (TDN, % of DM) ÷ 1.23
Where the divisor, 1.23, is used to adjust the
equation to have a mean and range similar to RFV.
The following two equations are recommended depending on whether or not the primary forage is legume or grass:
♦ For alfalfa, clovers, and legume/grass mixtures the equations will be:
A. Total digestible nutrients for alfalfa, clovers and legume/grass mixtures are calculated from the new NRC recommendations (NRC, 2011) using in vitro estimates of digestible NDF (not those calculated from lignin) as follows:
TDNlegume = (NFC × 0.98) + (CP × 0.93) + (FA × 0.97 × 2.25) + [NDFn × (NDFD/1000)] − 7
Where:
CP = crude protein (% of DM)
EE = ether extract (% of DM)
FA = fatty acids (% of DM) = ether extract − 1
NDF = neutral detergent fiber (% of DM)
NDFCP = neutral detergent fiber crude protein
NDFn = nitrogen free NDF = NDF – NDFCP, otherwise estimated as NDFn = NDF × 0.93
NDFD = 48-hour in vitro NDF digestibility (% of NDF)
NFC = non fibrous carbohydrate (% of DM) = 100 − NDFn + CP + EE + ash)
B. Dry matter intake calculations for alfalfa, clover and legume/grass mixtures will be:
DMIlegume = 120/NDF + (NDFD − 45) × 0.374/1350 × 100
(Mertens, 1987 with NDFD adjustment proposed by
Oba and Allen (1999). 45 is an average value for
fiber digestibility of alfalfa and alfalfa/grass mixtures.)
Where DMI is expressed as % of body weight (BW), NDF as % of DM and NDFD as % of NDF.
C. Relative forage quality can be found using:
RFQ = (DMIleg, % of BW) × (TDNleg, % of DM) ÷ 1.23
♦ For warm and cool season grasses the equations will be:
A. Total digestible nutrients for warm and cool season grasses are calculated as:
TDNgrass = (NFC × 0.98) + (CP × 0.87) + (FA × 0.97 × 2.25) + (NDFn × NDFDp/100) − 10
(Moore and Undersander, 2002)
Where terms are as defined previously and
NDFDp = 22.7 + 0.664 × NDFD
B. Dry matter intake calculations for warm and cool season grasses will be:
DMIgrass = -2.318 + 0.442 × CP − 0.01 × CP2 − 0.0638 × TDN + 0.000922 × TDN2 + 0.18 × ADF − 0.00196 × CP × ADF
(Moore and Kunkle, 1999)
Where DMI is expressed as % of BW, and CP, ADF, and TDN are expressed as % of DM
C. Relative forage quality can be found using:
RFQ = (DMIgrass, % of BW) × (TDNgrass, % of DM) ÷ 1.23
How do RFV and RFQ compare?
During the springs of 2006, 2007, and 2009 the University of Wisconsin-Extension Team Forage conducted a study to determine the rate of alfalfa forage quality change during spring growth. In particular, the interest was in the rate of digestible fiber change and the relationship of RFV to RFQ rates of change.
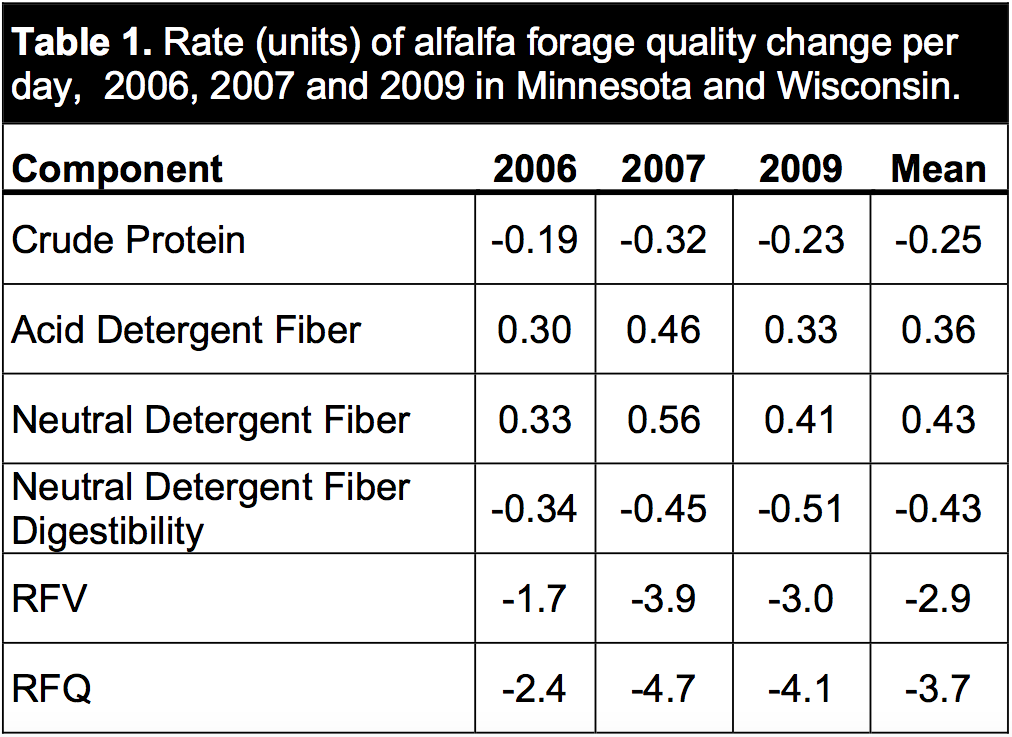
The study consisted of repeated samplings of alfalfa according to the scissors clip procedure at three sites in 2006, at over a dozen sites across Minnesota and Wisconsin in 2007, and at a dozen sites across Wisconsin in 2009. Samples were collected from approximately early May to mid-June depending on the season. There were a total of 34 samples in 2006, 158 samples in 2007 and 112 samples in 2009. All samples were analyzed at the UW Marshfield Soil and Forage Testing Laboratory using NIR analysis and in vitro analysis.
The average rates of change of several forage quality components are presented in Table 1. Generally the rate of quality change was slightly less in 2006 than 2007 or 2009. When summarizing data collected from nearly thirty site-years, it is important to acknowledge the rate of forage quality change does have some variation from year to year and location to location.
The data for comparison of RFV and RFQ changes during 2007 are presented as a typical example in the Figure 1. As expected, there was a high correlation between the RFV and RFQ rates of change for each year (r2= 0.96 to 0.97). Also, as expected, the rate of RFQ change per day was higher than the rate of RFV change per day This is due to the fact that RFQ rate of change is composed of both the NDF rate of change (which is a responsible for the RFV rate of change) and the fiber digestibility rate of change. Overall, the rate of change relationship was very consistent with the rate of RFQ change being 1.3 times RFV in 2006 and 2009, and 1.2 times RFV in 2007. Thus, when making a harvest timing decision, it is important to be aware that the new RFQ estimate is not identical to RFV.
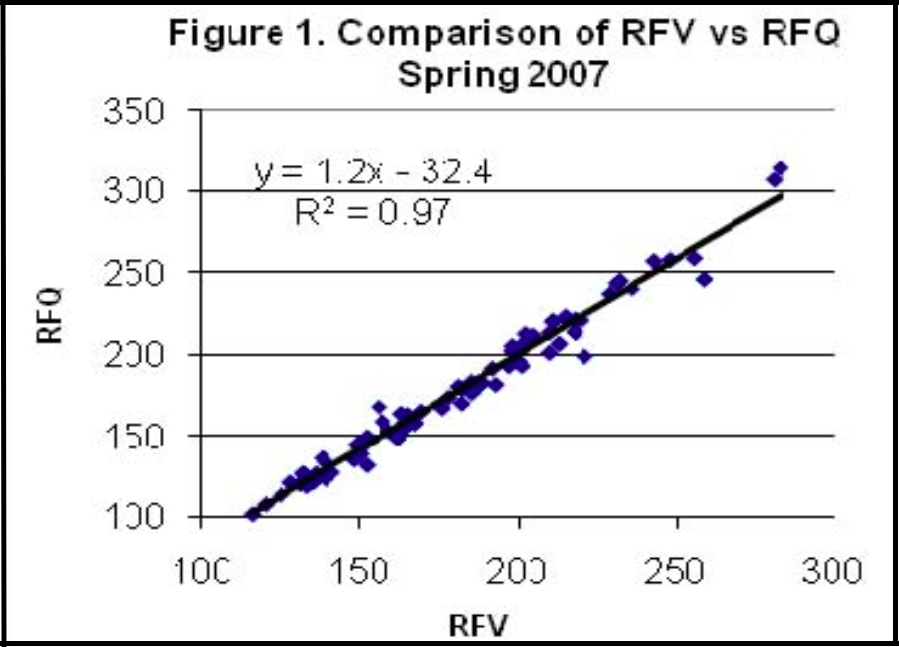
It should be noted that this data pertains to first cutting only. Other data suggests that the NDFd rate of change is lower on later cuttings so the relationship of RFV to RFQ rate of change may vary among cuttings during the growing season. Another major difference is there is a bias specific to that year. In some years RFQ started with a much higher index value than RFV compared to other years because of differences in digestible fiber.
When and how do I use RFQ?
Since RFQ includes digestible fiber, we believe that it is more representative of the way an animal would perform on a given forage. Therefore, whenever RFV and RFQ are different, RFQ is the better value to use. In general, RFQ is appropriate for use with all forages except corn silage because RFQ does not account for differences in starch availability. We believe that it more accurately reflects forage quality than previous measurements and should be used for determining when to harvest, allocating forages to animals, buying and selling hay based on forage quality, and contracting for harvest with a quality incentive.
Source:uwex.edu