While on the higher side of pre-report estimates, the USDA September Crop Production report shows corn and soybean yields are down from 2018 and lower than the projections posted in the USDA August Crop Production report.
Corn Production
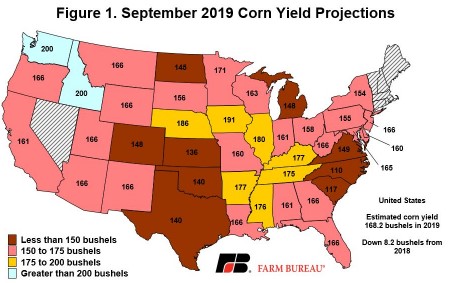
Corn production for 2019 is now projected at 13.8 billion bushels, 1% lower than the August estimate of 13.9 billion bushels and down 4% from 2018. September corn yield on a national scale is estimated to be 168.2 bushels per acre in 2019, down more than 8 bushels per acre from 2018 and 1.3 bushels per acre lower than the August estimate. Across the U.S., corn yields were the highest in Iowa at 191 bushels per acre, followed by Nebraska at 186 bushels per acre, Figure 1.
Corn yields took the biggest month-to-month hit in the Northwest and the South. Yield projections in Idaho and Washington dropped by 10 bushels per acre, while yield expectation dropped by 7 bushels per acre in Michigan. In Louisiana, the average corn yield was reduced by 15 bushels per acre. Note, these yield expectations are as of September 1, so potential yield declines related to Hurricane Dorian were not included in these estimates. Figure 2 highlights the change in yield projections from the August report to the September report.
Soybean Production
Soybean production in 2019 is now projected at 3.6 billion bushels, down slightly from the August estimate but down nearly 1 billion bushels, or 20%, from 2018. Soybean acreage is down by 12.5 million acres from last year. The large production decline is driven by the trade impasse with China and the lower soybean exports and prices that have come with it. The national average soybean yield was projected at 47.9 bushels per acre, 3.7 bushels lower than last year and down 0.6 bushels per acre from the August report. Soybean yields were the highest in portions of the western Corn Belt, Figure 3.
Relative to the August projection, Texas saw the largest decrease in its soybean yield, but the update is only a slight decrease from 2018 yields. Similarly, Georgia, Virginia and Maryland had lower expected yields from the August report to the September report, which pushed those states below their 2018 yields, Figure 4.
Summary
Excessive spring rains and flooding across the Midwest forced delayed and prevented plantings, pushing crop yields down in 2019. As illustrated in Figures 5 and 6, most states will experience corn and soybean yield declines in 2019.
Click here to see more...