By Scott Irwin
Department of Agricultural and Consumer Economics
University of Illinois
A recent farmdoc daily article (April 28, 2022) examined the impact of late planting on the U.S. average corn yield. The regression estimates indicated a 10 percent increase in late planting leads to about a 2 bushels per acre decrease in the U.S. average corn yield. The results showed that the impact of late planting is linear and rather modest, causing the national corn yield to deviate above or below trend by no more than three bushels in most years. This result is surprising when compared to the findings on planting date impacts from agronomic field trials, which show non-linear and large yield penalties for planting corn after mid-May. One possible explanation for the difference is that the regression estimates are based on U.S. average observations, while the agronomic field trials are state specific. The purpose of this article is to compare regression estimates of late planting impacts and field trial results for the same state—Illinois. This will be helpful in assessing the role of geographic aggregation in the differing findings between the two types of studies.
Analysis
The starting point for the analysis is defining the beginning date for a significant late planting penalty for corn yields. Like our recent analysis for the U.S. (farmdoc daily, April 28, 2022), we define the beginning date for substantial late planting penalties on corn yield in Illinois to be May 30th from 1980 through 1985 and May 20th from 1986 onwards. The change in cutoff dates in the mid-1980s reflects recommendations for earlier planting that appeared around that time.
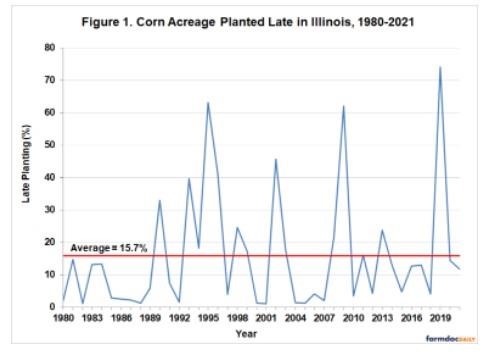
Figure 1 shows the percentage of corn planted late in Illinois based on the previous definitions over 1980 through 2021. On average, late planting was 15.7 percent, with the bulk of the observations between about 5 and 20 percent. There are four years with exceptionally high levels of late planting: 1995, 2002, 2009, and 2019. The largest level of late planting in the sample is 74 percent in 2019. There is no evidence of a trend up or down over time in the late planting percentage, which suggests that producer behavior in aggregate with respect to late corn planting in Illinois has been quite stable (after adjusting for earlier planting through time).
The next step of the analysis is to estimate the impact of late planting on the Illinois average corn yield. Figure 2 show the relationship between the trend deviation for the statewide yield of corn Illinois and corn acreage planted late over 1980 through 2021. The trend deviation is computed based on a linear trend for Illinois average corn yield over this period. The figure shows that, as expected, there is an overall negative relationship between late planting and corn yield deviations from trend. Specifically, for a 10 percent increase in late planting the Illinois average corn yield decreases by about 1.3 bushels per acre. In comparison, the maximum loss in yield from high levels of late planting can be much larger. For example, the model predicts that the 74 percent level of late planting in 2019 leads to a 7.3 bushel decline below trend. However, the overall impact of late planting is linear and rather modest, causing the Illinois corn yield to deviate above or below trend by no more than two bushels in most years.
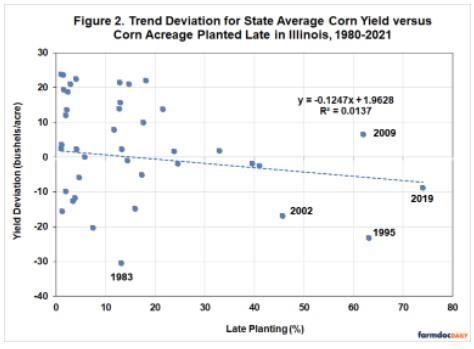
It is also important to emphasize that the explanatory power of the regression model in Figure 2 is quite low, as the R2 is only 1.4 percent. The implication is that there is a huge range in yield outcomes for any given level of late planting. Likewise, there are years with low levels of late planting and low yields and vice versa. Two years provide good examples. Late planting was well-above average in 2009 but the corn yield was above trend due to a cool, wet summer. Conversely, late planting in 1983 was relatively low but corn yield was extremely low due to a severe drought that summer.
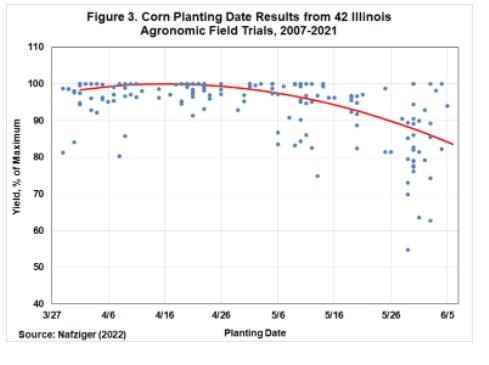
We can now compare the state regression results for late planting in Illinois with results for agronomic field trials for corn planting dates in Illinois (farmdoc daily, April 14, 2022). Figure 3 presents the results from 42 central and northern Illinois field trial locations over 2007-2021. Data from these experimental field trials reveal two key patterns. First, there is a relatively wide time window for planting corn in Illinois and expecting “normal” yields. This window runs from roughly early April though early May. Second, the yield penalty is non-linear and increases sharply for planting past mid-May, with reductions as large as 10 to 20 percent. If we assume an Illinois average trend yield for corn in 2022 of 195 bushels per acre, this could then be used to project yield reductions of 20 to 40 bushels per acre below trend for the corn planted past mid-May, with large resulting impacts on the Illinois state average yield of corn. This computation is not meant to be exact, but only to illustrate the non-linear nature of the yield penalty estimated for planting corn in Illinois after mid-May using data from experimental trials.
It is now clear that using data for the same state did not eliminate the difference in findings for the two types of late planting studies. Whether yield data for Illinois or the U.S. is employed, the estimated size of late planting impacts from regression studies is linear and fairly small when compared to the non-linear and large late planting impacts based on agronomic field trials. There are several possible reasons for the differences:
- The planting trial results are reported as the percentage of maximum yield in a test location for a given year, which is not the same as deviation from trend yield. The maximum trial yield in any year can be far above or below trend yield for the state or the entire U.S., and the maximum varies across trial locations. This creates an inherent apples and oranges problem when comparing results from the two types of studies.
- The planting trial results are site-specific within Illinois, while the data used in regression studies are state averages. State average observations may still be at too high of a level of aggregation to accurately reflect impacts at a local level.
- The explanatory power of planting date in field trial studies is not as high as commonly perceived. For example, the R2 of the regression equation shown in Figure 3 in only 12.6 percent. This means there is a wide variation in the yield outcome in field trials for a particular planting date, especially the later the planting date. As an example, the lowest yield observation for corn in Figure 3 occurs on June 2nd at 62.7 percent of the maximum yield. Other trial outcomes for the same date result in yield at the maximum of 100 percent. The lesson is that there is a wide potential range of yield outcomes on a given planting date even in field trials.
- There may be a small sample problem with state aggregate data used in regression studies. As shown in Figure 2, there are only a handful of years with late planting greater than 40 percent. These are the years where we would expect late planting impacts to be large, mirroring the non-linear impacts found for very late planting dates in the field trial studies. It may be the case that summer weather was better than average simply by chance in this small handful of years. This was certainly the case in 2019, which was a record year for late planting. If we assume that field trial data is the best available, this means in the future we should expect to see a cluster of years with high levels of late planting and large negative deviations below trend yield. At that point, the aggregate data used in regression studies would show a similar non-linear relationship as is found in field trial studies.
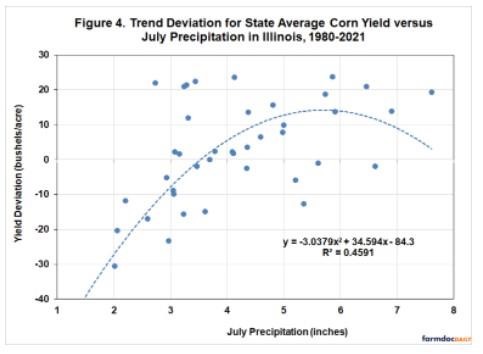
It is important to keep one thing in mind when considering late planting impacts on corn yield from either type of study. The low explanatory power of late planting means that other factors, in particular summer weather, are much more important in explaining deviations from trend yield (e.g., Nielsen, 2015). This is highlighted in Figure 4, which shows trend yield deviation for corn in Illinois versus July precipitation over 1980 through 2021. Nearly half of the trend yield variation from year-to-year is explained by this single variable. The point is not that late planting should be ignored when projecting corn yield, but rather, that its importance should kept in perspective.
Implications
In this article, we compare regression estimates of late planting impacts and field trial results for the same state—Illinois. The regression estimates indicate a 10 percent increase in late planting leads to the Illinois average corn yield decreasing by about 1.3 bushels per acre. Mirroring earlier results for this U.S., the overall impact of late planting is linear and rather modest, causing the Illinois corn yield to deviate above or below trend by no more than two bushels in most years. This can be compared to the results from field trials that the yield penalty for planting past mid-May is non-linear and substantial, with reductions as large as 10 to 20 percent. There is no single explanation for the different results between the two types of studies. Whatever is the correct explanation, it is important to keep in mind that the explanatory power of late planting is low in both types of studies. Other factors are much more important. For example, July precipitation explains nearly half of the trend yield variation from year-to-year in Illinois. It is no wonder that the “golden number” for corn production in the U.S. is July precipitation. Planting date is a sideshow by comparison.
Source : illinois.edu