By Chris Zoller
Liquidity is a measure of the ability of a farm to use cash or ability to convert assets to cash quickly to meet short-term (less than 12 months) liabilities when due. Data from the United States Department of Agriculture Economic Research Service (USDA-ERS) forecast a continued decline in 2020 of liquidity on U.S. farms. This article discusses two metrics, the current ratio and working capital, to evaluate liquidity.
Working Capital
USDA-ERS projects farm working capital to decline from the 2012 level of more than $160 billion to $52 billion in 2020 (see Chart 1). Working capital is the value of cash and short-term assets that can easily be converted to cash minus amounts due to creditors within 12 months. These are considered “short-term” assets and liabilities. Having adequate working capital is important for a farm to meet obligations as they come due, take advantage of pre-pay discounts, and manage through price declines or unexpected expenses.
Like many things in agriculture, knowing how much working capital a farm needs varies based on several factors. These include farm size, farm type, and market volatility. The working capital to gross revenue ratio is a measurement of the working capital divided by the gross sales of the business. This ratio measures the amount of working capital compared to the size of the business. Lenders prefer a working capital to gross revenues ratio of 40 percent or better. This means that if the business has $1 million in gross sales, working capital would need to be $400,000 or 40 percent of $1M. When the working capital ratio falls below .20, a farm may have difficulty meeting cash obligations .in a timely manner.
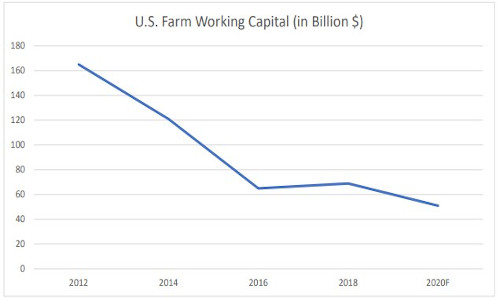
Chart 1. (Source: USDA-ERS, February 5, 2020) (see PDF version to access charts)
Current Ratio
The current ratio is calculated as total current assets divided by total current debt (or liabilities). Current is defined as less than 12 months. Current assets include: cash, accounts receivable, fertilizer and supplies, investment in growing crops, crops held for storage and feed, and market livestock. Current liabilities include: accounts payable/accrued expenses, income and social security taxes payable, current portion of deferred taxes, current loans due within one year, current portion of term debt, and accrued interest.
USDA-ERS expects the value of current assets to decline 3.5% and current liabilities to increase 2.3% in 2020. The current ratio of U.S. agriculture was 2.87 in 2012 and is projected by USDA-ERS to fall to 1.42 in 2020 (see Chart 2). If a farm has $100,000 in current assets and $70,000 in current liabilities, the current ratio equals 1.42. A current ratio of 2:1 or greater is desirable and indicates a farm has $2 in short-term assets for every $1 in short-term debt.
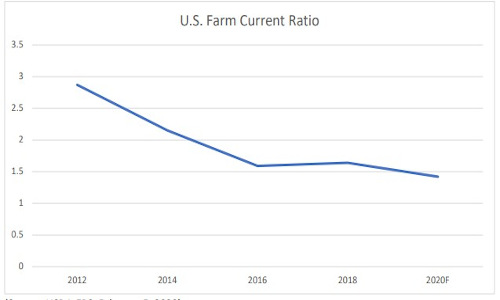
Chart 2. (Source: USDA-ERS, February 5, 2020) (see PDF version to access charts)
Management Tips
Farm financial management is critical in today’s volatile environment. Consider the following management tips:
- Complete an annual balance sheet. Using your numbers, calculate trends.
- Compare your numbers with recommended benchmark values.
- Discuss your numbers with your lender.
- Contact your local Extension educator or enroll in the Ohio State University Extension Farm Business Analysis and Benchmarking Program (https://farmprofitability.osu.edu/).
Source : osu.edu