By Sarah Lancaster et al.,
This is the second article in the “World of Weeds” series. The first article was all about mistletoe and appeared in Issue 778 on December 20, 2019.
Ecology of kochia
Kochia, also known as tumbleweed, is native to Europe and Asia and was introduced from Europe as an ornamental in the mid- to late- 1800s. It is well adapted to the Great Plains. Kochia is related to common lambsquarters and Russian thistle and is similar to them in some ways.
Kochia has alternate, lance-shaped leaves with 3-5 prominent veins and hairs on the margins and lower surface (Figure 1). Small green flowers are formed at the base of leaves in late summer and early fall. Kochia is a round or pyramid-shaped plant with many branches that can grow up to 6 feet tall (Figure 2).
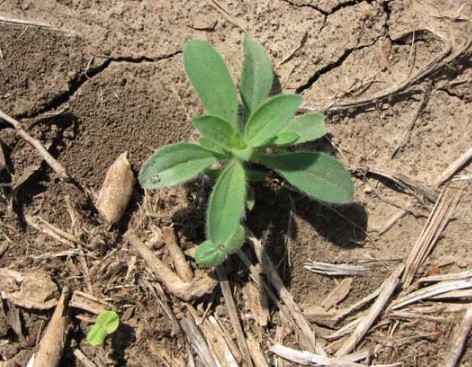
Figure 1. Example of a kochia seedling. Photo by Dallas Peterson, K-State Research and Extension.
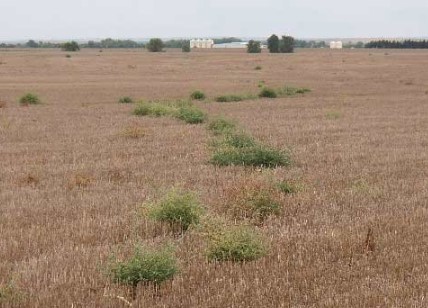
Figure 2. Kochia plant that is approximately 6 feet tall. Photo by Dallas Peterson, K-State Research and Extension.
In Kansas, kochia generally emerges in March, but can emerge as early as late January. Kochia can produce more than 50,000 seeds per plant, which are spread when the matured plant breaks off at the soil surface and tumbles in the wind (Figure 3). Kochia seeds are viable in the soil seedbank for only 1 to 2 years.
Kochia can be grazed when it is young and is credited with helping ranchers survive droughts of the early 20th century. However, it can accumulate harmful levels of nitrates and has been linked to photosensitivity in livestock.
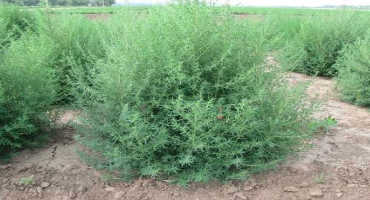
Figure 3. Pattern of seed dispersal by wind-blown kochia. Photo by Dallas Peterson, K-State Research and Extension.
Management
If uncontrolled, kochia can reduce soybean yield by 30%, corn and sorghum yield by about 40%, and wheat yield by 58%. Kochia populations in Kansas have confirmed resistance to: chlorsulforon (Group 2), dicamba and fluroxypyr (Group 4), atrazine (Group 5), and glyphosate (Group 9).
Resistance to key post-emergence herbicides coupled with early emergence makes herbicide timing critical for kochia management. Pre-emergence herbicides should be applied in fall or very early spring. Products below are listed as examples. Always read and follow label directions.
Herbicide | Rate/acre | Group (s) | Crop | Timing |
Fierce EZ | 6 fl oz | 14, 15 | C, SB, F | PRE |
Lumax EZ | 2.7 qt | 5, 15, 27 | C, GS | PRE |
Sencor | 0.5 lbs | 5 | SB, W1, F, | BD, PRE |
Spartan | 6 oz | 14 | SB | BD, PRE |
StaraneNXT | 27.4 fl oz | 4, 6 | C, GS, W | POST |
Glyphosate (Several) | 2 pts | 9 | C2, SB2 | POST |
Gramoxone SL | 3 pts | 22 | F | BD |
Laudis | 3 fl oz | 27 | C | POST |
C=corn, GS = grain sorghum, SB=soybean, W = wheat, F = fallow, BD = burndown
1Tolerant varieties only; 2Resistant varieties only
Source : ksu.edu