By Gary Schnitkey
Department of Agricultural and Consumer Economics
University of Illinois
This article presents information useful in determining appropriate levels of 2019 cash rents including average cash rents for the state of Illinois, average cash rents for counties, and average cash rents for differing Productivity Indexes. Also presented are expected 2019 cash rents on professionally managed farmland. Increases in non-land costs and lower soybean prices will put considerable downward pressures on 2019 cash rents.
Average Illinois Cash Rents
The National Agricultural Statistical Service (NASS), an agency of the U.S. Department of Agriculture, regularly reports average cash rents for the state of Illinois. The average cash rent for 2018 is $223 per acre, up by $5 per acre from the 2017 value of $218 per acre. The increase between 2017 and 2018 was the first increase since 2014. From 2014 to 2017, cash rents declined $17 per acre from $234 per acre in 2014 to $218 in 2017. The 2014 cash rent was an all-time high, with much of the increase occurring in the higher income years from 2006 to 2016 (see Figure 1).
Average Cash Rents by County
Figure 2 shows average cash rents for each county in Illinois for 2017. NASS did not report average cash rents for 2018. Given the average $5 per acre increase in state cash rents, adding $5 to each of the average 2017 cash rent would result in an approximate 2018 value.
As can be seen in Figure 1, cash rents vary across the state. The highest county cash rents are in central Illinois, with Logan County having the highest cash rent of $289 per acre. Southern Illinois counties tend to have lower cash rents, with Johnson County having the lowest cash rent of $72 per acre. Much of the variability in county cash rents across counties is attributable to productivity, with counties with higher farmland productivity having higher cash rents.
Average Cash Rents by Productivity Indexes
Last year, a relationship was fit that gave average cash rent based on a farm’s Productivity Index (PI). More detail on this relationship is in a farmdoc daily article dated November 7, 2017, including how to determine the PI for a farm. The relationship has been updated to account for the $5 per acre average increase in cash rents between 2017 and 2018.
The equation determining the average cash rent includes terms for a farm’s PI and the Crop Reporting District (CRD) where the farm is located:
Average cash rent = -142 + (2.79 x PI) + CRD adjustment.
The CRD adjustments are shown in Table 1.
To illustrate, take a farm with a 134 PI located in Champaign County. Champaign County is in the East CRD which has an adjustment factor of $26 (see Table 2). Given this information, the average cash rent for this farm is $258 per acre (-142 + (2.79 x 234 PI) x $26 CRD adjustment).
Cash rents can vary considerably from these averages, with some farms having $50 higher cash rents and some farms having $50 per acre lower cash rents.
Rents on Professionally Managed Farmland
In recent years, rents on professionally management farmland have been above the averages. In August, the Illinois Society of Professional Farm Managers and Rural Appraisers (ISPFMRA) released their estimates of 2018 cash rents on professionally managed farmland, as well as their expectations for 2019 cash rents (see here). Table 1 shows rents and expected cash rents for professionally managed farmland as well as for averages reported by NASS. Cash rents are given for four farmland productivities:
- Excellent productivity farmland has PIs above 133. Expected corn yields on typically exceed 205 bushels per acre. Professional farm managers are expecting rents to decrease from $305 per acre in 2018 to $290 per acre in 2019.
- Good productivity farmland has PIS between 117 and 132. Expected corn yields for this land productivity class are between 185 and 215 bushels per acre. Cash rents are expected to decreases from $265 per acre in 2018 to $250 per acre in 2019.
- Average productivity farmland has PIS between 100 and 116. Expected corn yields for this productivity class are between 167 and 185 bushels per acre. Professional farm managers are expecting cash rent to decrease from $220 per acre in 2018 to $210 per acre in 2019.
- Fair productivity farmland has PIs less than 100. Cash rents are expected to decrease from $185 per acre in 2018 to $175 per acre in 2019.
Outlook for 2019 Cash Rents
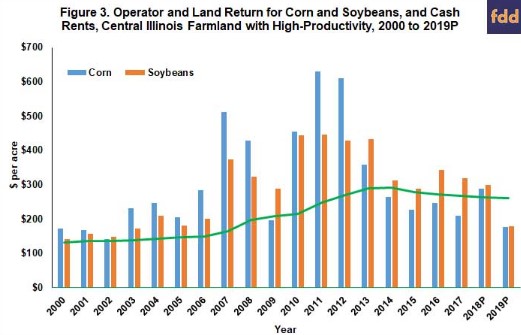
Expectations are for much lower soybean prices in 2019 than in recent years. In addition, energy-related costs are expected to increase. And there likely will not be any government assistance in the form of Market Facilitation Program (MFP) payments in 2019. As a result, farmland returns are expected to be much lower in 2019 than in 2018 (see farmdoc daily, September 18, 2018). Operator and farmland returns – a measure of the return left to split between the farmer and landowner – is projected to be about $80 lower than average cash rent levels in 2019 (see Figure 3). Those losses result in negative net farm incomes on many farms.
There will be downward pressures placed on cash rents as a result of these lowered expected returns. Much of the outlook depends on whether China continues tariffs on agricultural imports from the United States. Cash rents need to be lowered if soybean prices remain below $9 per bushel. However, prices expectations could change and become more favorable. Flexibility in setting cash rents seems key at this point in time (farmdoc daily, August 2, 2018).