Net farm income, a broad measure of profits, is forecast to increase $4.0 billion (4.8 percent) from 2018 to $88.0 billion in 2019. Net cash farm income is forecast to increase $7.6 billion (7.3 percent) to $112.6 billion. In inflation-adjusted 2019 dollars, net farm income is forecast to increase $2.5 billion (2.9 percent) and net cash farm income is forecast to increase $5.8 billion (5.4 percent). If realized, inflation-adjusted net farm income would remain slightly below its historical average across 2000-18 ($90.1 billion) and net cash farm income would be above its 2000-18 average ($108.3 billion).
Summary Findings
- Overall, farm cash receipts are forecast to decrease $2.4 billion (0.6 percent) to $371.1 billion in 2019. Total animal/animal product receipts are expected to increase $0.9 billion (0.5 percent) and total crop receipts are expected to decrease $3.3 billion (1.7 percent) from 2018 levels. Receipts for milk and hogs are forecast to increase largely due to expected higher prices while receipts for soybeans are forecast to decline due to expected lower prices and lower quantities sold. When adjusted for inflation, total animal/animal product receipts are forecast to decline $2.3 billion (1.3 percent).
- Direct government farm payments—which include Federal farm program payments paid directly to farmers and ranchers but exclude USDA loans and insurance indemnity payments made by the Federal Crop Insurance Corporation (FCIC)—are forecast to increase $5.8 billion (42.5 percent) to $19.5 billion in 2019, following higher payments from the Market Facilitation Program.
- Total production expenses, including expenses associated with operator dwellings, are forecast to increase $1.5 billion (0.4 percent) in 2019 to $346.1 billion. Feed expenses are forecast to increase $2.3 billion (4.4 percent) and hired labor expenses to increase $1.7 billion (6.2 percent). Expenditures on seed, pesticides, fuels/oils, and interest are expected to decline. After adjusting for inflation, total production expenses are forecast to decrease $4.6 billion (1.3 percent).
- Farm sector equity is expected to increase by 1.8 percent to $2.67 trillion in nominal terms. Farm sector assets are forecast to increase 2.0 percent in 2019 to $3.1 trillion as farm real estate assets are forecast to increase 1.9 percent. Most liquidity measures are expected to weaken, with working capital levels forecast down 18.7 percent to $56.9 billion. Farm sector debt is forecast to rise 3.4 percent to $415.7 billion, with real estate debt forecast to rise 4.6 percent to $257.1 billion. Debt-to-asset levels for the sector are forecast to rise again in 2019, continuing an upward trend since 2012.
Crop Receipts Expected To Decrease in 2019
Crop cash receipts are forecast to be $193.7 billion in 2019, a decrease of $3.3 billion (1.7 percent) from 2018 in nominal terms. Lower receipts for soybeans and cotton are expected to more than offset higher receipts for wheat and vegetables and melons.
Soybean receipts in 2019 are expected to decrease ($5.7 billion or 14.3 percent), reflecting anticipated declines in both price and quantities sold. Corn receipts are expected to fall $0.2 billion (0.4 percent) in 2019, reflecting a forecast decrease in quantity sold. The decrease ($0.6 billion or 7.4 percent) in 2019 cotton receipts reflects expected decreases in cash receipts for upland cotton lint and extra-long staple (ELS) cotton lint. Wheat receipts are expected to increase almost $0.7 billion (7.5 percent) from 2018, reflecting an increase in quantity sold alongside a slight price decline. Rice receipts are forecast to increase ($0.1 billion or 4.5 percent) in 2019, reflecting higher quantities sold.
Vegetable and melon cash receipts are expected to rise $1.1 billion (6.0 percent) in 2019. Cash receipts for fruits and nuts are expected to rise $0.5 billion (1.7 percent) in 2019.
Animal/Animal Product Receipts Forecast Relatively Unchanged in 2019
Total animal/animal product cash receipts are expected to rise $0.9 billion (0.5 percent) to $177.4 billion in 2019, reflecting increased receipts for milk, hogs, and turkeys. When adjusted for inflation, total animal/animal product receipts are forecast to decline $2.3 billion (1.3 percent).
Milk receipts are expected to increase $4.5 billion (12.7 percent) in 2019 in nominal terms, reflecting an increase in both price and quantities of milk sold. Cash receipts from cattle and calves are expected to increase $0.2 billion (0.3 percent), reflecting an increase in quantities sold. Hog cash receipts are expected to increase $3.4 billion (16.2 percent) in 2019, reflecting a rise in both price and quantities of hogs sold.
Broiler receipts are expected to decline ($3.9 billion or 12.4 percent) in 2019 due to a price drop, with only a marginal increase in quantities sold. Chicken egg receipts are expected to fall $3.8 billion (35.9 percent), reflecting lower prices. Turkey receipts are expected to increase $0.4 billion (10.8 percent) in 2019, reflecting higher prices and quantities sold.
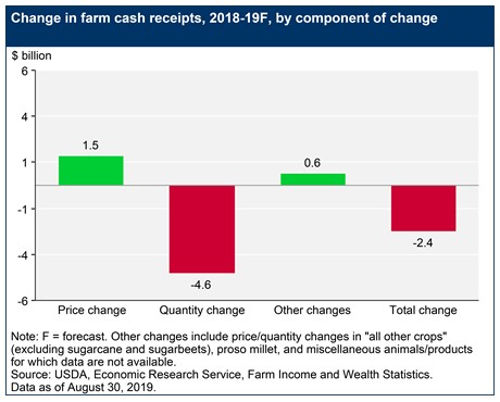
Higher Expected Commodity Prices Insufficient To Raise 2019 Cash Receipts
To better understand the factors underlying the forecast change in annual receipts from 2018 to 2019, we decompose the change into two separate effects: (1) a "price effect" where we project the change in cash receipts associated with holding the quantity sold constant at 2018 levels and allowing prices to change to forecast 2019 levels, and (2) a "quantity effect" where prices are held constant from 2018 and quantities change to forecast 2019 levels. In general, forecast prices tended to support higher cash receipts but this effect was overwhelmed by lower quantities marketed during the 2019 calendar year. The price and quantity effects were different for crop versus livestock commodities, with crops generally facing higher prices but lower quantities and animals/animal products generally facing lower prices and higher quantities. The price and quantity sold effects combined for an overall decline of $2.4 billion in 2019 cash receipts. Additionally, cash receipts increased $0.6 billion for commodities whose price and quantity effects could not be separately determined.
Direct Government Farm Payments Forecast To Increase in 2019
Direct government farm program payments are those made "directly" by the Federal Government to farmers and ranchers without any intermediaries. Government payment amounts do not include FCIC insurance indemnity payments (listed as a separate component of farm income) or USDA loans (listed as a liability in the balance sheet). Direct government farm program payments are forecast to increase 42.5 percent ($5.8 billion) from 2018 to 2019 (see table on
government payments). Nearly all of the increase reflects anticipated higher payments from the Market Facilitation Program, which is included under miscellaneous programs. Increases are also expected for supplemental and ad hoc disaster assistance, loan deficiency payments, marketing loan gains, and the new Dairy Margin Coverage program introduced with the 2018 Farm Act.
- Payments in 2019 under the Price Loss Coverage (PLC) program are expected to increase modestly due to higher payments for feed grains and rice, and the addition of seed cotton to the program, as authorized by the Bipartisan Budget Act of 2018. Agriculture Risk Coverage (ARC) payments are expected to decline because of a large drop in payments for wheat. Payments are also expected to increase for the marketing loan gains and the loan deficiency programs.
- Conservation payments—reflecting the financial assistance programs of USDA's Farm Service Agency and Natural Resources Conservation Service—are expected to fall to $3.7 billion in 2019, down 8.4 percent from 2018.
- The Dairy Margin Coverage Program (DMC), which replaced the Dairy Margin Protection Program (Dairy MPP) in the 2018 Farm Act, is forecast to make net payments of $0.6 billion to dairy operators in 2019.
- Supplemental and ad hoc disaster assistance payments in 2019 are forecast to increase $0.8 billion (87.1 percent) from 2018. A large outlay is anticipated from a new program, the Wildfire and Hurricane Indemnity Program (WHIP+) enacted through the Disaster Relief Act of 2019.
- The large payments projected for the miscellaneous programs category reflect payments from the Market Facilitation Program to assist farmers in response to trade disruptions. The 2019 forecast includes payments from the program first implemented in 2018 but received by producers in calendar year 2019, plus the expected payments from the first tranche of the program announced in 2019. We assume producers will receive 50 percent of the announced total of $14.5 billion in the first tranche.
Click here to see more...