By Gary Schnitkey and Krista Swanson et.al
Department of Agricultural and Consumer Economics
University of Illinois and
By Carl Zulauf
Department of Agricultural, Environmental and Development Economics
Ohio State University
Average net farm income on Illinois grains farms was above-average in 2020 primarily because of two factors: 1) higher corn and soybean prices in the second half of 2020, and 2) Federal aid through the Coronavirus Food Assistance Program (CFAP) and Payment Protection Program (PPP). Despite higher net farm income, farmers did not increase family living relative to 2019. Instead, capital purchases were above average, and working capital increased.
2021 Net Farm Incomes
Figure 1 shows average net farm incomes on Illinois grain farms enrolled in Illinois Farm Business Farm Management (FBFM) from 1996 to 2020. The number of farms included in these averages varies by year. In 2020, over 2,100 farms were included in the averages. The average farm size was 1,300 acres; however, there is a considerable range in size from farms below 500 acres to farms with over 15,000 acres.
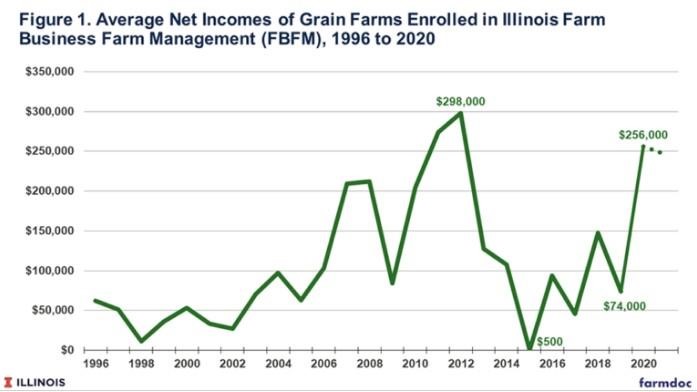
In 2020, the average net farm income on these farms was $256,000 per farm, considerably above average net farm income from 2014 to 2019 of $78,000. From 2014-2019, corn and soybean prices were much lower than during the period of expansion in domestic ethanol production and increased export demand from 2006 to 2013. From 2006-2013, net farm income averaged $189,000. In 2020, net farm income was above the 2006-2013 average and was the third highest in history, surpassed only by 2011 income of $274,000 and 2012 income of $298,000.
Corn and soybean prices were very low until August and then began to rise, improving expectations for returns from grain sales later in the year. For example, during the first week of August, cash prices in central Illinois averaged near $3.05 per bushel and $8.70 per bushel for soybeans. By the end of 2020, prices increased, reaching $4.75 for corn and $13.00 for soybeans. Higher prices, combined with above-trend yields on many farms, resulted in above-average crop revenue on most grain farms.
Additional government payments also increased income. In 2020, the administration introduced the Coronavirus Food Assistance Program (CFAP) to counter the negative impacts of the pandemic on global demand. In addition, many farmers applied for the Paycheck Protection Program (PPP) and Economic Disaster Assistance Loan (EDIL) assistance offered through the Small Business Administration. These programs contributed about $74,000 to farmer income, or about 28% of income. Without these payments, 2020 incomes would have been $182,000.
Uses of 2020 Funds
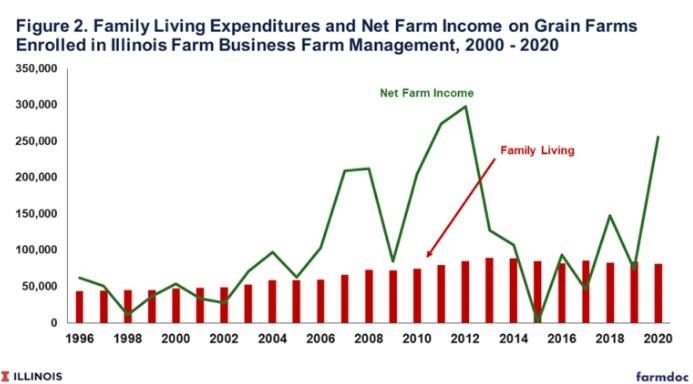
Although net farm income rose in 2020, farm families enrolled in Illinois FBFM did not increase family living on average (see Figure 2). Family living declined from $84,000 in 2019 to $81,000 in 2020, a decline of close to 3%. Overall, family living has been increasing over time at about a 2.8% rate per year and is relatively stable from year to year. The 2020 decline could be due to the economic uncertainties introduced by Covid-19, as well as limitations on activity associated with pandemic control measures.
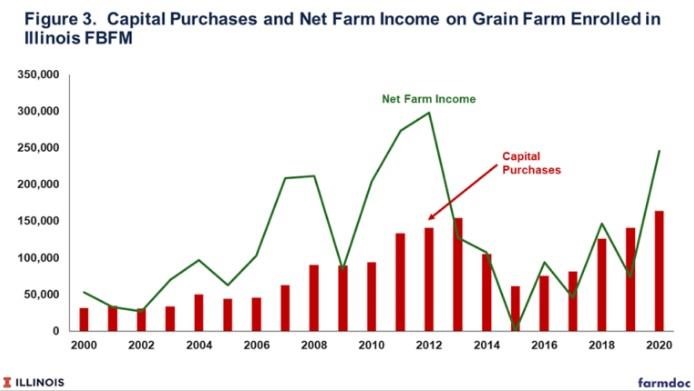
The additional 2020 income was primarily used in two ways. First, capital expenditures on machinery and buildings increased from $141,000 in 2019 to $164,000 in 2020, an increase of 16% (see Figure 3). Capital expenditures were at record levels in 2020, exceeding the previous high of $155,000 in 2013. Overall, capital expenditures are correlated with net farm income (correlation coefficient of .64), and the high income in 2020 contributed to record capital expenditures. This suggests that farmers used a portion of the additional income to build and/or maintain the asset base of their farm businesses.
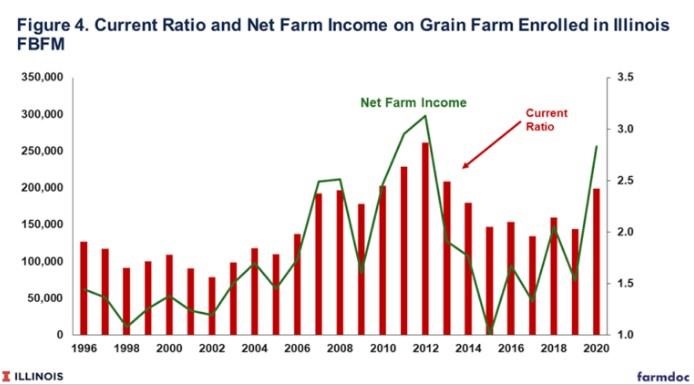
Farmers also improved their working capital positions. A measure of working capital is the current ratio, which equals current assets divided by current debt. Ratios above 2.0 are generally viewed as providing adequate working capital for either emergencies or economic opportunities. Values below 1.0 indicate that the business does not have enough funds to cover current obligations, which is generally a troublesome indicator for the farm business. The current ratio increased from 2.03 in 2019 to 2.42 in 2020, an increase of 19% (see Figure 4). The 19% increase was the largest since 1996, when consistent measures of the current ratio began.
On average, current liabilities did not decrease between 2019 and 2020. Instead, current assets increased, with about 40% of the increase coming in cash and equivalent balances, and the remaining 60% increase was in the value of grain inventories. Much of the grain inventory increase is due to higher grain prices, which may not continue into future years. Still, working capital increased substantially for 2020.
Implications for 2021
In general, farmers used the high net farm incomes in 2020 to improve the financial position of their farm business by 1) building the asset base through capital purchases and 2) improving working capital. In contrast, farms did not, on average, use the increased income in 2020 to finance greater family living expenses.
Net farm incomes likely will be higher again in 2021. History suggests increased expenditures on capital purchases likely will continue in 2021 and working capital will further increase.
Source : illinois.edu