By Gary Schnitkey
Department of Agricultural and
Consumer Economics
University of Illinois
and Carl Zulauf
Department of Agricultural, Environmental and
Development Economics
Ohio State University
We update the 2023 Crop Budgets to reflect declining corn and soybean bids for fall delivery. At currently projected price levels — $5.00 per bushel for corn and $12.30 for soybeans — farmer returns will be negative on cash-rented farmland. If prices stay at current levels, or continue to move lower, adjustments will be needed for 2024 production to achieve positive returns.
Updated Budgets
Initial 2023 Illinois Crop Budgets were released on August 2, 2022 (see farmdoc daily, August 2, 2022). As is our custom, those budgets are revised several times through the planning season. The most recent revision was posted on December 6, 2022. Compared to the previous version, today’s revision contains several significant changes:
- Corn and soybean prices are revised downward. The budgeted corn price was $5.50 in the December 6 version and is now $5.00. The budgeted soybean price was set at $13.30 in the December 6 version and is now $12.30.
- Costs are also revised to reflect updated information. In general, our estimates of 2023 costs have increased since the earlier budget releases.
Updated 2023 projections are contained in two publications in the Management section of farmdoc. First, the 2023 Illinois Crop Budgets give corn-after-corn, corn-after-soybeans, soybeans-after-corn, soybeans-after-soybeans, and wheat budgets for four regions: northern Illinois, central Illinois with high-productivity farmland, central Illinois with low-productivity farmland, and southern Illinois. A double-crop soybeans budget also is given for all regions except northern Illinois. The second publication — Revenue and Costs for Illinois Grain Crops — shows yearly returns and costs of producing corn, soybeans, wheat, and double-crop soybeans by region of Illinois. These budgets represent average returns regardless of the preceding crop and are summarized from farms enrolled in Illinois Farm Business Farm Management (FBFM).
Projected Corn and Soybean Prices
Expectations of 2023 fall delivery prices have fallen in recent months. For example, settlement prices of the December 2023 Chicago Mercantile Exchange (CME) corn contract during the month of February resulted in a $5.91 per bushel projected price for corn. As of mid-May, it is trading at $5.10. Similarly, the November CME soybean contract declined from $13.76 per bushel in February down to $12 per bushel in mid-May.
Several factors contributed to these price declines. Markets have seemingly adjusted to the ongoing Ukraine-Russia conflict. While Argentina has poor crop prospects due to severe drought conditions, Brazil is projected to have good production levels, with 2022/23 soybean production at record levels (farmdoc daily, March 31, 2023). In the U.S., spring planting has gotten off to a fast start, leading to expectations of trend yields. All of those factors contribute to supply increases while demand remains stable, leading to the recent price declines.
On May 8, the Office of the Chief Economist of the U.S. Department of Agriculture released its monthly World Agricultural Supply and Demand Estimates (WASDE) report. In this report, the first WASDE estimates of the 2023/24 supply and use sheets were released, which include estimates of the 2023/24 market year average (MYA) prices. For corn, the 2023 MYA price is estimated at $4.80 per bushel, lower than the 2021 and 2022 MYA prices of $5.95 and $6.75, respectively (see Figure 1). For soybeans, the 2023 MYA price is projected at $12.10 per bushel, down from 2021 and 2022 levels of $13.60 and $14.35, respectively.
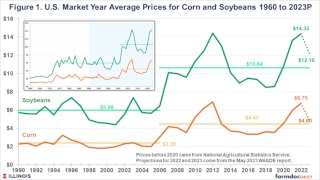
While down from 2021 and 2022 levels, 2023 projected MYA prices are not particularly low relative to history. From 2006 to 2021, corn prices averaged $4.47. Generally, agricultural economists believe commodity prices do not trend up or down for long periods but vary around a long-run price. Since 2006, that long-run price appears to be near $4.47 per bushel (see Figure 1). For soybeans, the average price from 2006 to 2021 is $10.64. Both corn and soybean prices reached a new, higher plateau in the mid-2000s at the beginning of the period in which corn was increasingly used to produce ethanol and export market demand for soybeans strengthened. Prior to this more recent period, from 1975 to 2005, corn prices averaged $2.38 per bushel, and soybean prices averaged $5.98.
The current lower 2023 prices may be a harbinger to a period like that after 2012. In 2012, corn and soybean prices reached highs after several years of supply disruptions around the world, including the 2012 drought in Midwest states (see Figure 1). From a high of $6.69 in 2012, corn price fell to $4.46 in 2013, near the average of 2006-2021 prices. Then, corn prices fell to $3.70 in the 2014 marketing year. Much needs to occur on both the demand and supply sides before this scenario is repeated. Currently, attention will focus on 2023 growing season weather, with particular emphasis on critical July weather.
For revised 2023 Illinois Crop Budgets, we will use a $5.00 corn price and a $12.30 soybean price, slightly above WASDE projected prices. We use higher prices based on the assumption that farmers have already contracted a portion of 2023 at the previously higher price levels.
Costs and Returns
Table 1 shows revenues, costs, and returns for corn and soybeans grown on high-productivity farmland in central Illinois. Summaries from grain farms enrolled in Illinois FBFM are shown in 2021 and 2022, and projections are shown for 2023. Again, $5.00 corn and $12.30 soybean prices are used for 2023 projections. Yields are set at trend: 227 bushels per acre for corn and 72 bushels per acre for soybeans. Crop revenue then is $1,135 per acre for corn and $866 per acre for soybeans.
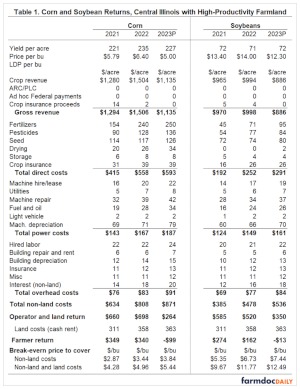
We are projecting no other revenues. The commodity title programs — Agriculture Risk Coverage (ARC) and Price Loss Coverage (PLC) — will not trigger payments at those prices and yields. Moreover, no ad hoc disaster assistance is scheduled at this point. Crop insurance also will not make payments at budgeted prices and yields, although harvest time contracts are close to triggering payments at current levels. At an 85% coverage level and assuming yields equal Actual Production History (APH) yields, revenue insurance on corn will trigger payments at $5.02 ($5.91 projected price x 85% coverage level). Revenue insurance on soybeans will trigger at $11.70 ($13.78 x .85). Budgeted prices close to insurance triggering points suggest that projected return levels shown in these budgets are near the lowest possible levels for farmers with high crop insurance coverage levels.
Total non-land costs are projected at $871 per acre for corn and $536 for soybeans. Both cost levels are above 2022 levels. Corn non-land costs are $63 per acre higher ($871 in 2023 minus $808 in 2022). Soybean costs are $58 per acre higher ($536 in 2023 minus $478 in 2022). Larger costs increases occurred between 2021 and 2022: non-land costs for corn increased $174 per acre and soybean costs increased $93 per acre.
Farmer Returns and Commentary
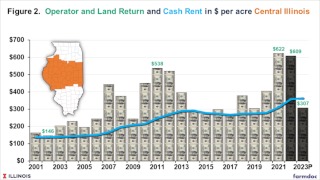
Operator and land return represents the return to farmers before paying for farmland. Operator and land return for corn is projected at $264 per acre in 2023, down $434 per acre from the $698 return in 2022. The operator and land return of $350 per acre for soybeans is down by $170 from the $520 return in 2022. In central Illinois, many farmers have 50% of their acres in corn and 50% in soybeans. Given this crop mix, the average operator and land return is $307 per acre (.50 x $264 corn return + .5 x $363 soybean return).
A $307 per acre farmer return is below the average projected cash rent of $363 per acre, resulting in a farmer return of -$56 per acre (see Figure 2). The last time negative returns occurred was in 2014 and 2015. From 2014 through 2017, net incomes on grain farms were low, resulting in declining financial positions over those years.
Much remains to be determined about 2023 returns. Higher returns could easily result from changing demand conditions or lower yields causing higher prices. Even if lower returns result, ad hoc Federal payments can occur, resulting in some relief from potentially low returns. Much remains to be seen.
Even if low and negative returns do occur, significant financial stress likely will not result on most farms. Over the past several years, farmers generally have built financial reserves. Those financial reserves can now be used to mitigate low returns associated with 2023 production.
If prices remain at current projected levels and yields do not increase, adjustments will need to be made for future crop years. Costs for 2023 are primarily determined. However, plans for 2024 will begin in earnest in August and the fall. The current prices of $5.00 for corn and $12.30 for soybeans signal the need to adjust both land and non-land costs lower. Even lower prices will heighten the need to further lower costs. Planning for the 2024 crop likely will require multiple and potentially complex adjustments.
Source : illinois.edu