By Scott Irwin
Department of Agricultural and Consumer Economics
University of Illinois
Spikes in retail food prices during the early phase of the COVID-19 lockdown were a major concern of consumers and policymakers. Fortunately, the price spikes generally did not last past the summer of 2020 as bottlenecks in processing and transportation eased. This, however, was not the end of concerns about food price inflation in the U.S. and around the globe.
New concerns have arisen as grain and oilseed prices surged starting last August. One issue is that there appears to be a great deal of confusion about exactly what “food price inflation” represents. Hence, the purpose of this article is to present the basic facts on food price inflation at different levels of the food supply chain for the U.S.
Analysis
We begin the analysis by examining recent trends in one of the most popular indexes of food prices. This is the Food Price Index computed by the Food and Agricultural Organization (FAO) of the United Nations. It is referred to frequently in media coverage of food prices. There are several facts about the
FAO Food Price Index that are important to consider. First, it is based on export prices at major global locations for trade, such as the U.S. Gulf and Brazilian ports. Second, the export prices are then averaged to form sub-indexes. Third, the commodity group sub-indexes are then weighted by trade shares to compute the overall Food Price Index. The current base period for the trade shares and the FAO Food Price Index is 2014-16. The key thing to recognize is that the FAO Food Price Index represents the prices of raw agricultural commodities near or at the first handler level in the food supply chain.
Figure 1 shows monthly levels of the (nominal) FAO Food Price Index over January 1990 through February 2021. What stands out are the spikes in the Food Price Index in 2007-08 and then again in 2010-11. There has indeed been a surge in the Food Price Index in recent months. The most relevant measure of the recent run-up in the index is to compare February 2021 with February 2020 in order to eliminate the distortions caused by the pandemic in the first half of 2020. The February 2021 level of the Food Price Index was 116, which was up 17 percent versus the previous year. This is certainly a substantial increase but it only takes the index back near the level of 2014 and still well below the peaks in 2007-08 and 2010-11.
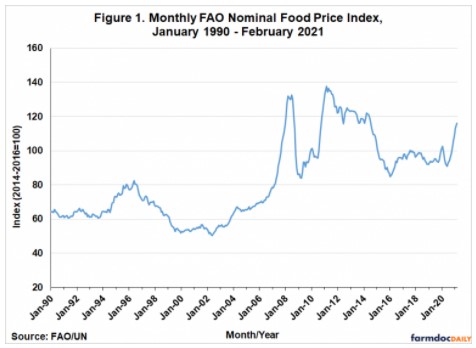
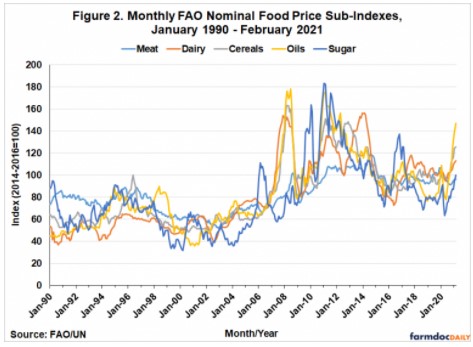
Figure 2 presents the monthly history of the sub-indexes for meat, dairy, cereals, oils, and sugar over January 1990 through February 2021. While there is certainly variation across the sub-indexes, the trends in the sub-indexes are broadly similar. This is also evident in cross-correlations between the monthly index observations, which range from 0.63 to 0.93. This is not surprising, as it is well-known that agricultural prices are often driven by similar underlying supply and demand fundamentals.
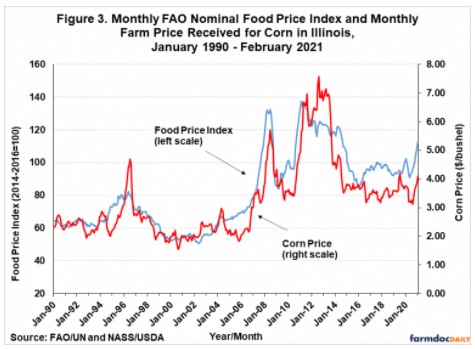
One possible concern at this point is that an international Food Price Index may not be representative of food price trends in the U.S. For this reason, Figure 3 shows the FAO Food Price Index and the monthly average farm price received for corn in Illinois. There is a striking similarity in the movement of the two price series, which is reflected by the high correlation over this sample period of 0.90. The high correlation is due to the fact that international markets for highly-traded agricultural commodities are tightly integrated. This also suggests that the FAO Food Price Index should be a reasonably accurate measure of food price movements in the U.S. at the raw commodity level.
The next step in the analysis is to compare price movements from the raw, or farm, level of the agricultural supply chain with price movements at the retail level. We do this because our ultimate interest is the price of food that consumers pay at the retail level. Figure 4 presents the annual percentage change in the FAO Food Price Index and the U.S. Consumer Price Index (CPI) for all food items over 1991 through 2019. The CPI measure used here accounts for all food purchased at home and away from home, so it is the broadest measure of retail food prices in the U.S. Annual data are used in order to smooth out monthly variation in both series and percentage changes are examined because our focus is not on levels but “food price inflation.” In addition, since a full year of monthly observations is not available for 2021, the last data point is 2020.
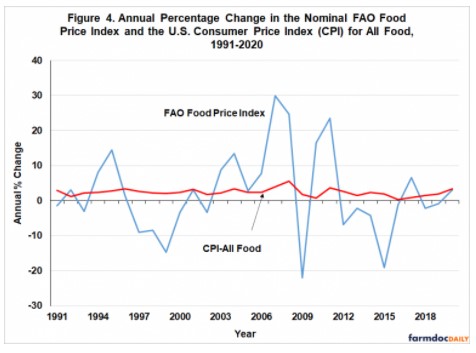
It is interesting to observe that the average rate of change for the FAO Food Price Index and the CPI for all food are very close at 2.2 and 2.4 percent, respectively. But the variation in the two series is wildly different. The standard deviation of the FAO index, 12.3 percent, is over 12 times larger than the standard deviation of the CPI for all food, which is 1.0 percent. Despite this huge difference in variation, there is still a tendency for the two series to move up and down together. The correlation over this sample period is moderately high at 0.47.
The relationship between raw and retail food prices is modelled more formally in Figure 5. This figure shows a scatterplot of the annual percentage changes for the FAO Food Price Index and the CPI for all food and an estimated regression line between the two series. There is clearly a positive relationship between changes in the FAO index and the CPI for all food, which, of course, makes sense. If raw material costs increase, then to some degree final retail costs will eventually also increase. However, the fit of the regression line is quite low with an R2 of only 0.23. The slope coefficient estimate is probably the most interesting. The estimate of 0.042 means that for each 10 percent change in the FAO index the CPI for all food will increase 0.4 percent. This is a quantitative estimate of the pass through of raw commodity price changes to retail food prices.
It is natural to expect that the pass through of raw commodity prices takes time as such adjustments are not costless. In order to account for this, we also estimated a regression model that includes both the current change in the FAO index and the change lagged by one year. This model fit the data considerably better, with an R2 of 0.50, and the coefficients on both current and lagged changes in the FAO index are statistically significant. It is also interesting to note that the coefficient on the lagged FAO index changes of 0.048 turns out to be larger than on the current FAO index changes, which is 0.033. A rough way to estimate the total change is to simply sum the two coefficients, which is 0.081. This implies that a 10 percent change in the FAO index results in a total 0.81 percent change in the all food CPI.
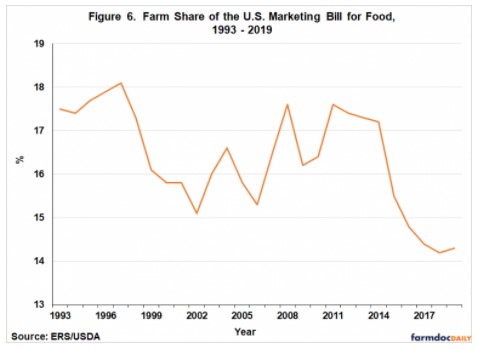
An obvious question at this point is why is the pass through coefficient for raw agricultural prices to final retail food prices in the U.S. so small? The answer is found in Figure 5, which shows the
USDA estimate of the farm share of the U.S. marketing bill for food over 1993 – 2019. The farm share measures the value of farm-level commodity sales relative to total food expenditure at non-farm establishments. In less technical terms, it is the share of total retail food spending in the U.S. that can be attributed to the cost of raw agricultural commodities. It is important to keep in mind that this marketing bill estimates represent an average across a very large number of food products.
Over 1993-2019, the farm share of the marketing bill shown in Figure 6 averaged 16.4 percent, with a downtrend since 2014. The farm share for the latest year available, 2019, is 14.3 percent. What this means is that for every dollar of retail food expenditure, 85.7 cents was due to processing, transportation, packaging, and marketing costs, and 14.3 cents was due to the cost of raw agricultural commodities. With raw commodity, or farm level, costs such a small proportion of final retail food costs it should now make sense why the pass through coefficient for raw agricultural price changes to the retail level is so small. In fact, the simplest estimate of pass through is the USDA marketing bill estimate. For example, consider a retail food item that costs $1 in 2019, of which 14.3 cents represents the raw commodity cost and 85.7 cents represents total marketing costs. A 10 percent increase in raw commodity cost is then 1.43 cents, which is exactly the amount that the retail cost of the item would increase with no change in marketing costs. It is also interesting to consider that the earlier regression estimates of pass through were in the same ballpark.
Finally, it is important to recognize that the small estimated pass through coefficients do not imply that raw agricultural price changes are not fully reflected in retail food costs. The reality is that raw commodity costs are such a small proportion of final retail food costs that even a large change in raw commodity prices will not change the retail cost all that much. This is key to reconciling why grain and oilseed prices can increase as much as they have in recent months, yet the official USDA forecast of food price inflation for the U.S. in 2021 is actually less than in 2020 (median forecast of 2.5 percent for 2021 versus 3.4 percent actual for 2020).
Implications
Whenever grain and oil prices increase substantially, as they have since last August, concerns seem to arise about the potential for food price inflation. In order to gauge the potential for food price inflation one has to understand a basic fact about the food supply chain in the U.S. The key is that raw, or farm level, agricultural commodity costs are a very small proportion of total retail cost of foods. For example, in the latest year for which data is available (2019) the USDA estimates that the farm share of the total retail cost of food in the U.S. is only 14.3 percent. The other 85.7 percent is the cost of processing, transportation, packaging, and marketing required to turn the raw commodity into a product in the grocery store aisle or in a restaurant. Since raw commodity costs are such a small proportion of final retail food costs. even a large change in raw commodity prices will not change the total retail cost all that much. This is why the latest surge in grain and oilseed prices is unlikely to lead to a significant bout of retail food price inflation.
An important caveat is that the analysis strictly only applies to developed economies like the U.S. where the farm share of retail food costs is quite low. In less developed economies the farm share of retail food costs is much higher because foods tend to be less processed and incur fewer marketing costs. This means consumers are more exposed to increases in raw commodity costs, like the recent surge in grain and oilseed prices.
Source : illinois.edu