By Bruce Sherrick and Gary Schnitkey
Department of Agricultural and Consumer Economics
University of Illinois
The 2020 price discovery period used to determine projected prices and volatility factors for Federally-sponsored corn and soybean crop insurance products is completed for areas with a 3/15 sales closing date (SCD). For the majority of the Cornbelt, the approved Projected Price (PP) for corn is $3.88 and the Volatility Factor (Vol) is .15, and for soybeans, the Projected Price is $9.17 with a Volatility Factor of .12.
Table 1 below contains Projected Prices, Volatility Factors, and Harvest Prices for the previous 10 years. The Projected Price (PP) and Harvest Price (HP) are used to determine guaranteed revenue based on futures prices, and do not reflect the local cash basis. The Projected Price for corn is determined by averaging the closing December futures price during the trading days of February, and for soybeans by averaging the November Futures closing prices during February. The volatility factors are determined by an average of the most recent five trading days’ implied volatility estimates, scaled for the interval of time from now until the middle of October — the month during which average prices are used to determine Harvest Prices.
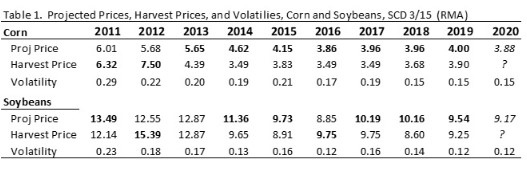
For corn, the projected price is $.12 below last year’s PP, and for soybeans $.37 lower than for 2019. As a result of lower PPs, coverage will be less in 2020 as compared to 2019 if the same coverage level has been selected and the Actual Production History (APH) yield has not changed greatly. The volatility factor summarizes the market’s estimates of the likelihood for price movements of various magnitudes, and has corresponding impacts on premiums paid for Revenue and Harvest Price related products. All else equal, lower volatilities result in lower premiums and vice versa, though other ratings changes from year to year often outweigh the direct effects. This year’s volatility estimates are the same as in 2019, suggesting that the market’s estimates of likely price changes has not changed greatly from 2019 to 2020.
The higher of the PP or HP is in bold each year in the table. Interestingly, corn Harvest Prices have not exceeded PPs since the drought year of 2012, in large part due to the exceptional run of relatively high yield years since 2013, and recently due to increased trade uncertainty impacts. Soybeans have a nearly similar story except for 2016, again largely explained by production patterns and basic supply and demand conditions. Both volatility factors are the same, but are at low levels relative to anytime prior to 2018. The lower PPs and volatility factors both make the cost of insurance lower, all else equal.
At the time of this writing — near the beginning of the insurance period, the November 2020 soybean futures price is about 9.085, or $.085 a below the Projected Price, and the corn futures price of $3.765 is more than a dime below the projected price. When actual futures prices are below the Projected Prices, there is a higher likelihood for experiencing an insured revenue shortfall because the insured price is somewhat above the market’s estimate of actual value; but the harvest price option decreases in relative value as it is then less likely that prices will end the insurance period above the Projected Price. When actual futures prices are higher than the projected price, there is an increased likelihood that products with the harvest price option embedded will result in an increase in guarantee value, but part of the market’s view of actual value is omitted from the insured portion. Importantly, the premiums for crop insurance products do not change in response to different price paths experienced during the establishment of the PP even though the values of coverage provided across different products are directly affected. In other words, the value of RP insurance is increased if the average price during February is above the futures price during the sales period, and the value of RP insurance is decreased if the average price during February is below the futures price during the sales period, but the cost of insurance is unaffected by either case. This fact can substantially influence the net cost of insurance from year to year, and can have a material effect on relative desirability of different products and coverage levels.
The question faced each year at this point on the calendar is: How can one sensibly evaluate their crop insurance options for their own case, reflecting current insurance information, current price expectations, and their own farm’s operating conditions? The following materials provide one approach for evaluating the most important crop insurance product and election choices facing corn and soybean producers using the University of Illinois iFARM crop insurance evaluator.
The case presented is for McLean County, a large and high yielding county in central Illinois. This case, and similar analyses for approximately 750 other counties throughout 11 states (IL, IN, IA, MD, MI, MN, ND, OH, SD, and WI) largely across the Midwest for both corn and soybeans under both basic and enterprise elections are available at the farmdoc website in the crop insurance section at: https://fd-tools.ncsa.illinois.edu/evaluator
The tool is free to use, but users need to register with their email and a chosen password. Importantly, there can be large differences in premiums even over short distances or among contiguous counties, and over the choice of unit and APH endorsement. Thus, while the case farm information provided for each county is helpful in understanding the relationships among choices, it is important to compare to conditions that most closely match your own case. It is also important to carefully discuss final options and decisions with a qualified insurance agent to insure accurate information about the specific costs.
The case farm information shown below is from McLean County, Illinois with starting price conditions are shown in the table below. It is assumed that the case farm qualifies for the Trend Adjusted APH endorsement which takes its average Corn APH from 188.2 to 198.97. The case shown is for a basic Unit on 100 acres (the online version can be selected for any county/crop of interest and toggled across units, and at actual acreage). The county standard deviation of yields is estimated to be about 36.39 bu./acre and the farm yield risk is about 9 bu./acre higher. Some basic risk information is given related to yield risk (e.g., 1 in 10 years the farm yield will be below 138, 1 in 5 years the county will be less than about 134 and so on), and the average (cash basis adjusted) gross revenue with no insurance is calculated at approximately $669/acre. The gross revenue calculation reflects the negative correlation between the yield and prices, as well as simulated local basis conditions and starting prices. The average futures price reflected in the is a result of the process used to model the price distribution implied by the options markets for the settlement period and can differ from current futures prices at any point in time, and importantly is connected to the actual futures prices, not the RMA Projected Price. This number updates regularly as market conditions change as well. Consistent with RMA rules, the APH and Trend APH are rounded to nearest whole bushels, and other features of the indemnity calculations are maintained to comply within RMA rules and procedures. The table below shows the case farm information for McLean County in more detail.
Click here to see more...