By Gary Schnitkey and Nick Paulson et.al
Department of Agricultural and Consumer Economics
University of Illinois and
By Carl Zulauf
Department of Agricultural, Environmental and Development Economics
Ohio State University
Over time, per acre input costs on grain farms tend to rise with commodity price increases (see also farmdoc daily, September 17, 2015). In this article, we illustrate this relationship for corn in 1) central Illinois using data from Illinois Farm Business Farm Management (FBFM) and 2) the U.S. using data from the Economic Research Service (ERS). Given current higher commodity prices, historical relationships suggest rising input costs for the 2022 crop. Sometime in the future, commodity prices will decline. When this occurs, history suggests that input costs will not decline as much as the commodity price decline.
Direct Costs and Corn Prices in Central Illinois for High-Productivity Farmland
Figure 1 shows per acre direct costs for corn grown on central Illinois farms with high-productivity farmland. Direct costs are summarized from data provided by Illinois FBFM. Direct costs include fertilizer, seed, pesticides, drying, storage, and crop insurance. From 2015 to 2021, fertilizer accounted for 40% of direct costs, seed for 30%, and pesticide for 19% (see Revenue and Costs for Illinois Grain Crops). Corn prices received by central Illinois grain farms are also shown in Figure 1. Direct costs and corn prices are correlated, exhibiting a .68 correlation coefficient from 2000 to 2021.
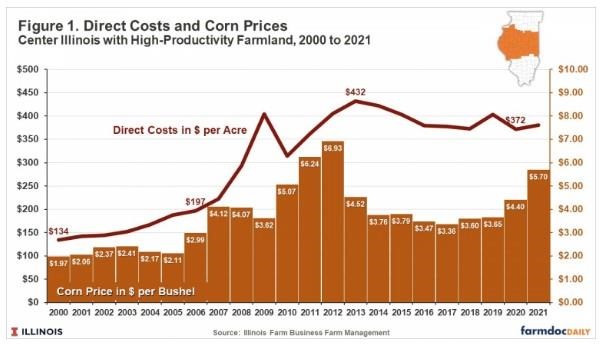
From 2000 to 2005, corn prices were relatively low, averaging $2.18 per bushel. The low was $1.97 per bushel in 2000, and the high was $2.41 in 2003. Direct costs rose from $134 per acre in 2000 to $188 in 2005, an average increase of $11 per year.
From 2006 to 2012 corn prices increased from $2.99 per bushel in 2006 to $6.93 per bushel in 2012. Beginning in 2006, corn use in ethanol production grew, reaching a relatively stable level in 2011. Prices peaked in 2011 and 2012, corresponding with the end of the period of growing ethanol use, plus a short crop in 2011 and a drought-reduced crop in 2012. Direct costs rose with these higher prices, increasing faster than in the 2000-2005 period. Direct costs increased at an average of $35 per year, reaching a high of $432 per acre in 2013.
From the 2012 high of $6.93 per bushel, corn prices fell to lower levels. From 2014 to 2019, corn prices averaged $3.61 per bushel. With a year lag, direct costs decreased from $432 per acre in 2013 to $380 per acre in 2016. From 2016 to 2021, direct costs were relatively stable, averaging $389 per acre.
Note that direct costs appear more reactive to price increases than to price declines. Direct costs rose more from 2006 to 2013 than they fell from 2013 to 2016 (see Figure 1).
Corn prices are again increasing, averaging $3.65 in 2019 and $4.40 in 2020. The U.S. Department of Agriculture is forecasting a national price of $5.70 per bushel for the 2021 crop. Given the history depicted in Figure 1, rising crop prices are expected to lead to increased direct costs.
Operating Costs and Corn Prices in the U.S.
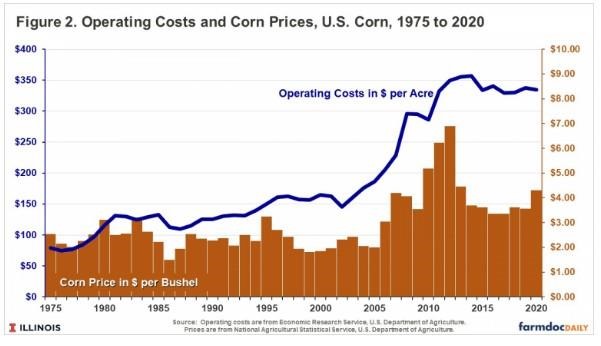
Relationships between costs and corn prices are not restricted to central Illinois but also exist across the U.S. Operating costs for the entire United States were obtained from the Economic Research Service, an agency of the U.S. Department of Agriculture. By ERS’s definition, operating costs include seed, fertilizer, chemicals, custom services, fuel and lubrication, repairs, irrigation water, and interest on operating notes. The operating costs used by ERS differ from direct costs for Illinois. ERS’s operating costs contain fuel and lubrication, repair, irrigation water, and interest, which are not included in Illinois’ direct costs. Illinois’ direct costs include crop insurance, which is not included in ERS’s operating costs. Both Illinois’ direct costs and ERS’s operating costs include fertilizer, seed, and pesticides. These three items make up the largest proportion of both sets of costs and are the cost items that vary the most over time.
Figure 2 shows operating costs from 1975 to 2020, along with market year average (MYA) prices for corn. MYA prices were obtained from the National Agricultural Statistics Service and are the same as currently used to calculate payments for commodity title programs. Overall prices were relatively stable from 1975 to 2006 while operating costs had a slight upward trend. Then, operating costs and corn prices increased from 2006 through 2012, similar to the trends shown for central Illinois. From 2013 to 2015, corn prices and operating costs fell, similar to results in central Illinois. Corn price and operating costs were relatively stable from 2015 to 2020 in both the U.S. and central Illinois.
Implications
Current higher commodity prices likely will lead to higher direct costs on grain farms. This trend is already occurring with fertilizer prices, with nitrogen and phosphorus fertilizers increasing by more than 50% between fall 2020 and spring 2021 (see farmdoc daily, April 20, 2021). Announcements of seed and chemical prices later this summer likely will confirm higher prices for other input items.
Economic reasons for correlated commodity prices and input costs can be given. Higher commodity prices generally lead to more acres, which lead to higher demand for inputs, putting upward pressures on input prices and input costs. Yields have been increasing over time, leading to operating costs to be a relatively stable portion of crop revenue. Moreover, all commodity prices, including grains, oils, and natural gas, tend to be correlated. One would expect the general increases impacting all goods after COVID will have impacts on farm input costs.
While commodity prices remain high, farmers could remain profitable even given rising input costs. Concerns occur when commodity prices fall. Given history, input costs likely will not decline as much as commodity prices, potentially leading to profitability issues in the future.
Source : illinois.edu