By Robert Tigner and Elliott Dennis
Forage, pasture, and weather conditions
Over the last several months, there have been increasing drought conditions that started in the Southwest and moved into some parts of the Northern Plains. As of August 2020, most of the Western U.S., including parts of western and central Nebraska, were experiencing or likely to develop drought conditions. The U.S. drought monitor is one tool that producers can use to monitor and track drought conditions in their region. Figure 1 displays an example of what the drought monitor looks like where darker shades of yellow and brown indicate varying levels of drought conditions.
The livestock industry monitors drought conditions because it affects the current and future availability of forages for cattle. As drought conditions worsen, cattle are forced to come off grass and enter feedlots earlier than anticipated. One way to monitor state level pasture conditions is through the weekly USDA-AMS crop progress report (USDA-NASS 2020). The USDA-AMS releases pasture conditions aggregated at both national and state level. Pasture is rated on a five-point scale from “very poor” to “excellent.” Nationally, pasture conditions rated “good” and “excellent” were at or around 30% to 35% in August 2020. This is 15% to 20% lower than 2019 and about 10% lower than the five-year average. Pasture conditions do vary by geographical region. Approximately 50% of pasture conditions in Nebraska were rated as “good” or “excellent” in August 2020. Other Northern Plains and Cornbelt states had comparable pasture quality conditions. Contrast these conditions with pasture conditions in the Southwest and Western parts of the U.S. Only 12% of pasture were rated “good” or “excellent” in New Mexico, 24% in Texas, and 23% in Utah, Arizona and California.
Drought conditions are not necessarily a bad thing if there are available forage stocks that livestock producers can utilize. Going into this forage production season, several southwestern states had comparatively low hay (alfalfa + other hay) stocks. For example, Colorado had 410,000 tons and New Mexico had 50,000 tons. Contrast that with most of the Midwest that had plenty of hay stocks as of May 2020. While the drought conditions may limit forage production this year, there appeared to be sufficient hay stocks to allow producers to bridge the gap in cattle feeding.
Producers deciding to supplement cattle with available feed resources should be aware of seasonal pricing patterns in alfalfa hay and other hay markets. Converting prices to a seasonal price index allows producers to see when prices are high or low across many years. Figure 2 displays the seasonal price index for alfalfa hay and Figure 3 displays the seasonal price index for “other hay” using data reported by the USDA-AMS from 2008-2019. Alfalfa prices tend to be the highest at the beginning of the forage season (March, April and May) since forage resources are generally running low. Prices for alfalfa are generally seasonally low in early winter months (January and February) as producers make decisions whether to retain or sell to feedlots. October and November are months where the price of alfalfa is relatively average and the risk (Max Index – Min Index) is the smallest. This implies that producers can have greater certainty about what the price of alfalfa will be. Pricing “other hay” follows different seasonal patterns. “Other hay” prices tend to be relatively steady with little variation from September to January. There are the highest prices and increasing variation from February to April. This implies that producers wanting to minimize the cost of supplemental feeding need to determine accurately the forage requirements due to winter weather to make appropriate feed purchase decisions.
What to do if we enter a period of drought?
Whether the industry is expanding or contracting when the drought occurs has important management implications. The cattle cycle is the process of expansion and contraction of the calf crop and tends to run in a six-step process: 1. Producers desire to expand their herds since feeder cattle prices are strong and operations are making profits. 2. Producers then retain replacement heifers. This causes fewer heifers to be sold, raising feeder cattle prices even more in the short run. 3. This dynamic amplifies the expansion signal where higher prices implies a greater need for expansion. 4. Eventually all the retained heifers become cows and the calf crop increases. The increase in calf crop lowers feeder cattle prices forcing inefficient producers to liquidate herds. 5. As more heifers and cows come to market due to liquidation it drives down prices further in the short run. 6. Now with fewer producers in the market and fewer heifers that have become cows the calf crop is reduced, and feeder cattle prices once again rise 7. The cycle then repeats itself beginning at step one
The current cattle cycle started in 2014. The 2020 January cattle inventory was the first time in this cycle where the calf crop and breeding herd was slightly smaller than the previous year. This is the first contractionary signal signaling the industry is at the top of the cattle cycle and likely three to four years before reaching any firm bottom. Droughts tend to amplify the liquidation signal since more heifers and cows are brought to market, further reducing feeder cattle prices in the short run. Less heifers retained and more cows culled implies that the calf crop in the next two years will be smaller. Thus, producers must engage in some level of forecasting about whether the drought will be a single or a multi-year drought. This smaller cow herd will produce a smaller calf crop and feeder cattle prices will rise. COVID-19 is likely to further amplify the liquidation period as more producers may not be able to cover their variable and fixed costs and decide to liquidate their herds.
Historically assessing drought impacts on ranch profitability
The decision of how to respond to a drought-produced forage shortage will always have short-term and possibly long-term financial impacts. Models, decision tools and budgets can assist ranchers with choosing a tactic that minimizes the negative financial outcome. The tactics usually used are depopulation and destocking. Depopulation means selling cows, heifer, yearlings and calves to fit the available forage. Destocking does not sell animals, but cattle are either moved to newly obtained pasture, rented or purchased, or purchased hay for the current herd size. Each of these two broad tactics has financial consequences.
Wyoming ag economists understood that the beef price cycle might also influence the financial outcome of the drought decision. Bastian et al. (2009) modeled the two choices Wyoming ranchers most often make during three- or four-year droughts with two different beef price cycles, peak-to-peak or trough-to-trough. For both drought lengths, purchasing feed results in negative returns for the peak-to-peak price cycle. Only in the trough-to-trough price cycle does purchased feed show positive returns. Comparing depopulation and purchased feed by drought length indicates that depopulation results in the highest net returns for either drought length. The Bastian et al. modeling also shows that the trough-to-trough price cycle results in higher returns than when a drought starts at the peak of the beef price cycle.
How to decide on an appropriate strategy?
The Bastian et al. (2009) study shows the need for ranchers to perform their own financial impact due diligence when droughts occur. Several tools can be used to assess which strategy to use including a spreadsheet, "Strategies for Cattle Herd During Drought," from Colorado State University. The spreadsheet compares three choices ranchers can make, buy feed, rent or buy pastures and sell cattle, to calculate possible financial results for each over several years. FinPack, a financial analysis program goes further, allowing the user to compare combinations of strategies or added enterprises during a drought. These combined strategies may perform better or differently than the Bastian et al. models and should be considered.
(Price) Risk management
There is an increasing need to manage risk regardless of whether a drought occurs. Production and price/market risk are two categories of risk that producers face. Declining pasture conditions due to drought, bomb cyclones, BSE, or a potential foot and mouth outbreak are examples of production risk. In the event that production reduces supply, feeder cattle prices will rise in the short run. Price risk, on the other hand, has little to do with the animals themselves and more to do with the market in which the animals are sold. These market conditions are often out of producer’s direct control. The US-China trade war, the Holcomb, Kan., packing plant fire, COVID-19 government restrictions and COVID-19 cases among packing plant workers are some examples of price risk events that have affected the cattle industry in the last two to three years. All of these dramatically affected consumer demand for beef and ultimately fed and feeder cattle. Figure 4 plots how feeder cattle futures markets have responded to select production and price risk events. As expected, production shocks temporarily raised feeder cattle prices whereas price risk events generally decreased feeder cattle prices. Depending upon the price risk shock, feeder cattle prices generally started to rise six weeks post event.
The 2020 growing season weather that produced drought conditions, like conditions in the Southwestern part of the United States, as well as in parts of western and central Nebraska, can impact prices received by producers. However, the probability of drought varies each year and an operation does not perfectly know when a drought will occur. Producers can mitigate some price risk through available risk management tools.
To illustrate, assume an operation in central Nebraska that sells 550 pound weaned steers and generally prices cattle in May for September delivery. All cattle that not priced are sold in the cash market at delivery. Assuming the producer can use five different price risk management tools (cash market sales only, hedging, “in the money” long put, “out of the money” long put, fence, or synthetic put, Table 1 displays how price risk management tools perform ($/cwt.) above the local NE cash price. Values that are greater than local cash prices are highlighted in green. On average, buying “in the money” puts yield a net price of $4.59 above NE local cash. Other strategies yield comparable outcomes. The multiyear drought in 2011 and 2012 caused feeder cattle prices to spike to historic highs in 2014. Excluding this year shows that a simple hedging strategy provided a similar return above local cash as buying “in the money” puts.
In summary, using available price risk management tools can effectively reduce some of the market price risk variability that is inherent in agricultural production that are caused by either production or price risk.
| Year | Hedge | Buy | Buy | Fence | Synth Put |
|---|
| | (Sell Futures) | ITM Put | OTM Put | | |
|---|
| 2010 | 4.38 | 4.64 | -1 | 0 | 3.38 |
|---|
| 2011 | 2.02 | 2.3 | -1 | 0 | 1.02 |
|---|
| 2012 | 12.51 | 12.6 | 5.6 | 6.6 | 11.51 |
|---|
| 2013 | -7.9 | -5 | -1 | -2.68 | -6.21 |
|---|
| 2014 | -44.81 | -5 | -1 | -39.02 | -6.79 |
|---|
| 2015 | 15.52 | 16.04 | 9.04 | 10.04 | 14.52 |
|---|
| 2016 | 9.78 | 10.37 | 3.37 | 4.37 | 8.78 |
|---|
| 2017 | -9.88 | -5 | -1 | -4.38 | -6.49 |
|---|
| 2018 | -7.3 | -5 | -1 | -2.02 | -6.28 |
|---|
| 2019 | 19.45 | 19.91 | 12.91 | 13.91 | 18.45 |
|---|
| | | | | | |
|---|
| Average | -0.62 | 4.59 | 2.49 | -1.32 | 3.19 |
|---|
| Exclude 2014 | 4.29 | 5.65 | 2.88 | 2.87 | 4.3 |
|---|
| Years Positive | 6 | 6 | 4 | 6 | 6 |
|---|
TABLE 1. Risk Management Analysis for Sample Operation in Central Nebraska
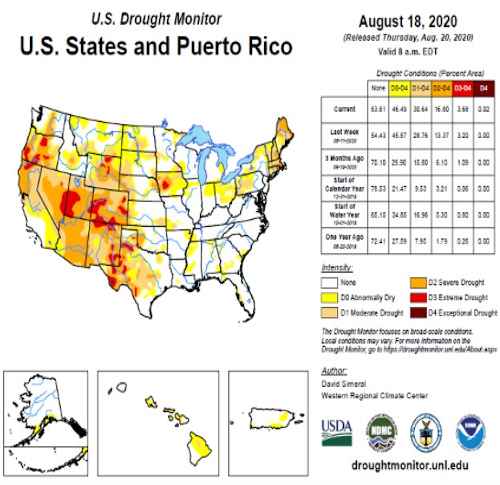
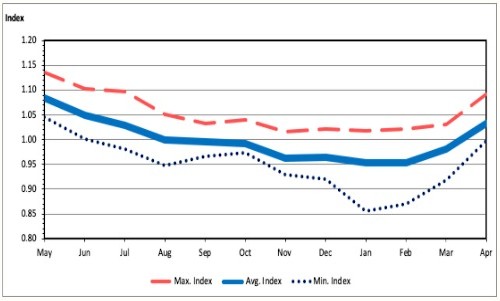
FIGURE 2. Seasonal Price Index for Alfalfa Hay
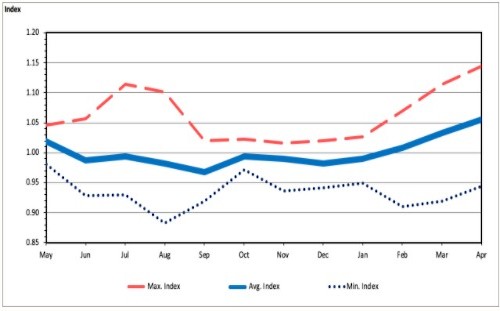
FIGURE 3. Seasonal Price Index for Other Hay
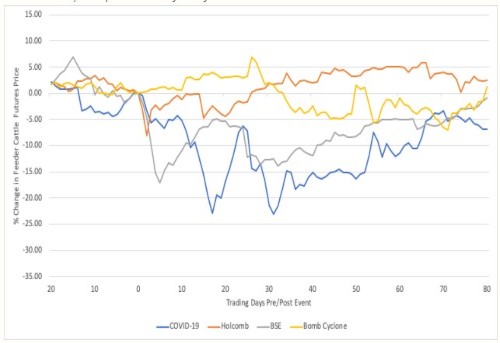
FIGURE 4. Change in Feeder Cattle Futures Prices Given Select Price and Production Shocks
Source : unl.edu