By Ben Brown
College of Agriculture, Food and Natural Resources
University of Missouri
By Carl Zulauf
Department of Agricultural, Environmental and Development Economics
Ohio State University
On March 31, 2021, USDA (US Department of Agriculture) will release its March 1 survey estimates in its March 31st Grain Stocks Report. This article provides estimates of US corn stocks as of March 1. A complimentary article estimating March 1 soybeans stocks can be found in the March 22, 2021 farmdoc daily article. With near record low ending stock to use ratio and relatively high prices for corn, the March stocks report should not be overshadowed by the 2021 Prospective Plantings Report also released on March 31.
In the March 9, 2021 WASDE (World Agricultural Supply and Demand Estimates), USDA estimated a US 2020/21 ending stock to use ratio of 10.3% for corn. If realized, this ratio will be the lowest since 2013/14 (9.2%). Multiple factors contributed to tightening US ending corn stocks, but the 2 most important were (1) lower 2020 US production due to the derecho and late season drought and (2) higher than expected purchases of US corn by the Peoples Republic of China. Nearby futures prices have increased 53% for corn since September 1, 2020, the start of the 2020/21 marketing year.
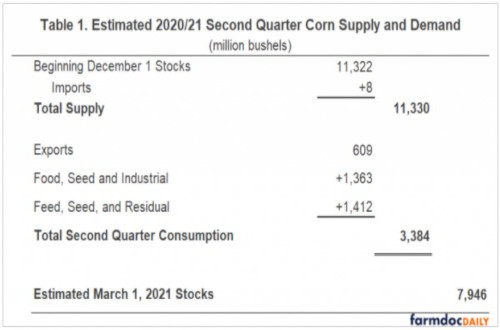
Estimating stocks begin with an estimate of supply at the start of the quarter. For the March 1 stock estimate, starting value is the December 1 stock estimate in the December Grain Stocks Report. These are stocks at the start of the December-February quarter. On December 1, 2020, corn stocks stored in all positions totaled 11.322 billion bushels. Corn unharvested as of December 1 is counted as on-farm storage and included in the Grain Stocks report. Adding in imports that totaled 8 million bushels during the quarter implies a total corn supply of 11.330 billion bushels.
USDA reserves the right to adjust Grain Stocks reports the following quarter and at the end of the year if errors are detected, production estimates are revised, or late reports are received. USDA quarterly stocks revisions have been occurring more often and increasing in size (see farmdoc daily, February 10, 2021, for more information). Obviously, changes in starting value mean estimates of ending stocks will be off by the revision in starting value even if the component estimates are accurate. December Grain Stocks will be used as the starting point to calculate March 1 corn stocks in this analysis, but the caveat discussed in this paragraph is important and needs to be kept in mind.
Uses of corn are exports, grindings that become inputs for industrial and food products, and domestic feeding. Corn exports can be estimated using weekly export inspection data provided by the Foreign Agriculture Service. Through the end of February cumulative export inspections since September 1 for corn totaled 1.011 billion bushels, roughly 43% of USDA’s forecasted export total for 2020/21. US Census Bureau count of total corn exports from September 1 through January 31 exceed corn inspections by 43 million bushels. Assuming this margin of difference stayed the same through February, corn exports for the first half of the marketing year totaled 1.054 billion bushels (1.011 billion + 43 million). Subtracting off first quarter exports (September 1- November 30) of 445 million bushels implies corn exports of 609 million bushels in the second quarter.
The Grain Crushing and Co-Products Production report, released March 1, estimated corn used for ethanol in January at 416 million bushels, down slightly from 430 million bushels in December. Using weekly estimates of ethanol production provided by the Energy Information Agency and recent conversion factors to account for sorghum used for ethanol, 370 million bushels is estimated as corn used for ethanol in February. Ethanol plants slowed production during a cold wave that hit the Midwest February 6-22. Adding in corn consumed for other, non-feed domestic purposes, corn grindings and seed use during the second quarter is estimated at 1.363 billion bushels- down 167 million bushels from last year.
Current USDA estimate for 2020/21 annual feed and residual use is 5.650 billion bushels, which is 175 million bushels less than the estimate at the beginning of the marketing year in September and 249 million bushels below last year’s feed and residual use. Feed and residual use was lowered 50 million bushels in the January 2021 WASDE on the indicated disappearance during the first quarter. First quarter December 1 stocks came in 629 million bushels lower than market analysts expected. Subtracting the 288-million-bushel difference between what analysts expected for 2020 corn production and USDA’s January production value implies a 341 (629 minus 288) million bushel increase above expectations for first quarter feed and residual use. First quarter feed and residual use is currently estimated at 2.724 billion bushels. Over the last four marketing years, the first half of the marketing year has represented roughly 67% of annual feed and residual use. Applying this historical rate to USDA’s current annual estimate implies 3.785 billion bushels used during the first half of the marketing year and 1.061 billion bushels during the second quarter. At 1.061 billion bushels, use in the second quarter would be 19% of estimated annual feed and residual use. In contrast, average share for the second quarter over the last 5 years is 25%. This historical comparison implies USDA could raise the annual feed and residual use number, lower 2020 US corn production, revise the December 1st stocks report, or indicate higher prices are expected to shrink the share of annual feed used in the second half of 2020/21. Given the time of the year, increases to annual feed and residual use, revisions to December 1st stocks report, or a mixture of both seem most likely. High cash prices relative to other feed grains, like wheat, decrease the use of corn in feed rations. However, all feed grains including distillers’ grains have seen increases over the past quarter. In summary, given current inventory of grain consuming animals and relative prices of other feed grains, 1.061 billion bushels for feed and residual may be low. Using the recent share of annual feed and residual use of 25% corn use equates to 1.412 billion bushels during the quarter and a first half of the marketing year representing 73% of USDA’s current estimate. Given the uncertainty in USDA’s feed and residual category, its interaction with other components, and the February cold snap with feed use typically declining during cold weather; uncertainty is greater than normal for feed and residual use during the December-February quarter.
Adding the estimates for corn exports of 609 million bushels, domestic food, seed, and industry use of 1,363 million bushels, and feed and residual use of 1,412 million bushels; total corn demand for the second quarter is estimated at 3,384 million bushels. Assuming no changes to second quarter beginning stocks, this usage estimate implies March 1st corn stocks of 7,946 million bushels-only 7 million bushels below corn stocks last year (March 1, 2020). This result is at first surprising given USDA currently estimates ending stocks for the entire marketing year will be 417 million bushels below last year. One explanation is the 1,549 million bushels of corn exports left to be shipped in the second half the marketing year. A second explanation is that use of corn for ethanol in the second half of 2020/21 market year is expected to be higher than during the second half of the 2019/20 market year due to the negative impact of Coronavirus on gasoline and thus ethanol consumption last spring and summer.
USDA’s March 1st stocks report and 2021 planting intentions, both released on March 31, 2021: will set the tone for corn prices over the last six months of the 2020/21 marketing year. The December 1 Grain Stocks report contained surprises related to 1st quarter corn consumption but was overshadowed by the 3.8-bushel reduction in 2020 corn yields released the same day. March 1, 2021 stocks will play an immense role in corn market dynamics, especially given that recent cumulative corn export sales for the 2020/21 market year so far exceed the season average pace needed to reach USDA’s current export target for the year by roughly 640 million bushels. Market observers will closely observe 2021 planting intentions as a first indication of 2021 US corn production potential, but corn consumers will depend on the March 1 stocks to meet their needs over the remaining five months of the 2020/21 marketing year. If the need is not met with domestic supply, imports to the US will be needed to fill the gap.
Table 1 summaries the estimates provided in the article.
Source : illinois.edu