By Melissa Wilson
The Minnesota Department of Agriculture, in partnership with the National Weather Service has designed a new tool for those applying manure in Minnesota called the
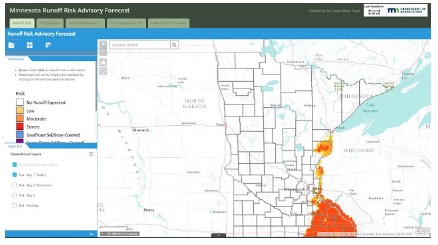
Minnesota Runoff Risk Advisory Forecast. The interactive map is designed to help farmers and custom manure applicators decide on the optimal time to apply manure by predicting or modeling when runoff events are likely to happen. As a bonus, the tool also provides forecasted precipitation amounts, as well as soil temperatures at 2 and 6 inches of depth to help with manure application decisions.
How does the runoff risk model work? It does more than just look at the rain forecast. It also takes into consideration soil moisture content, temperatures, and if applicable, snow accumulation and melt. With this information, it predicts the chance of runoff in the next one, two, or three days, at least when the ground is not frozen or snow-covered. Once the model moves into “winter mode,” it calculates the runoff risk potential for up to 10 days. Any time the model shows a moderate or severe risk, regardless of season, farmers and manure applicators should evaluate the situation and decide if there are other locations, like flatter areas that are less likely to have runoff, or other dates to apply the manure.
The Runoff Risk Advisory Forecast tool is a joint effort of the Minnesota Department of Agriculture and the National Weather Service and is paid for with Clean Water Funds. It is part of a larger regional project to provide this kind of tool in other states, including Wisconsin, Ohio, and Michigan.
Want to check it out? Click on the link above. From there, click on “See the Runoff Risk Forecast in your area” link to get to the interactive map. Or, you can sign up to get alerts sent to your phone. If you need more help, click on the “How to use this map” link at the bottom of the page.