By Carl Zulauf
Department of Agricultural, Environmental and Development Economics
Ohio State University
Corn processed into US ethanol has grown dramatically (see Figure1), and accounted for 37% of total US corn use during the 2018 market year (USDA (US Department of Agriculture), Office of the Chief Economist, November 2019). A related, but broader issue is, “Has ethanol increased total US corn use?” The simple analysis discussed in this article suggests that as of the 2018 market year the likely answer is yes, but the increase in total use is much smaller. Growth in corn processed into ethanol has been offset by substantial reductions in US domestic use of corn excluding ethanol and in US share of world corn exports. The latter is growing rapidly. Implications and key questions are drawn for the US corn market and US farm and ethanol policy.
Policies to Expand Corn Ethanol – Brief Overview: Source for the material in this brief overview are extension discussions of US ethanol and US ethanol policy by Duffield, Johansson, and Meyer (September 2015) and Wikipedia (November 2019). US Federal policies to promote ethanol started with the use of tax credits in the 1970s. Federal tax credits ended on December 31, 2011, but The Energy Policy Act of 2005 and Energy Independence and Security Act of 2007 had mandated annual ethanol use levels. The mandates remain in effect, but setting the annual amount generates intense controversy. Another key policy-related event was the discovery during the late 1990s that MTBE (methyl tertiary butyl ether), an oxygenate added to gasoline to reduce carbon monoxide emissions, was contaminating groundwater. States began to ban MTBE, opening the door for ETBE from ethanol to be used as an oxygenate additive. Final resolution in favor of ETBE occurred when a 2005 court decision denied legal protection for MTBE and The Energy Policy Act of 2005 removed the existing 2% oxygen requirement in reformulated gasoline.
Data and Procedures: Data used in this analysis are supply and demand components from WASDE (World Agricultural Supply and Demand Estimates) reports and the PSD (Production, Supply, and Demand) website, both from USDA. The analysis begins with the 1980 corn market year, the first year in which corn processed into ethanol was broken out for the US. The data end with the recently completed 2018 market year.
This analysis focuses on longer term trends. Thus, a 5-year Olympic average (5OA) of values for the current and past 4 years is used instead of the value for the current year. An Olympic average removes the high and low value before calculating the average. Both averaging and eliminating extreme values dampen variability. This smoothing feature of 5OA is visible in Figure 1 even though US corn ethanol use is not highly variable from year to year.
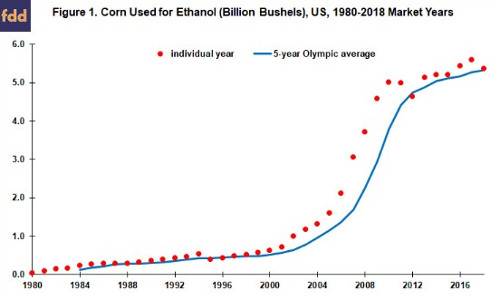
The 2004 corn market year is used as a break point in the analysis. The first ethanol mandate law was signed by the President in early August 2005. This was near the August 31, 2005 end of the 2004 corn market year, making the 2004 corn market year a reasonable break point. Moreover, while the substitution of ETBE for MTBE had been underway for several years, the issue reached its final resolution during the 2004 corn market year.
US Domestic Use of Corn Excluding Ethanol: From 1984, the first market year a 5OA can be calculated, through the 2004 market year, the 5OA of US domestic use of corn excluding ethanol grew by + 0.13 billion bushels per year (see Figure 2). Explanatory power of the linear time trend is 98%, implying little year-to-year variation from the trendline. US domestic use of corn excluding ethanol declined in the years following the 2005 and 2007 mandate laws. The 5OA of domestic corn use excluding ethanol started to grow again with the 2015 corn market year.
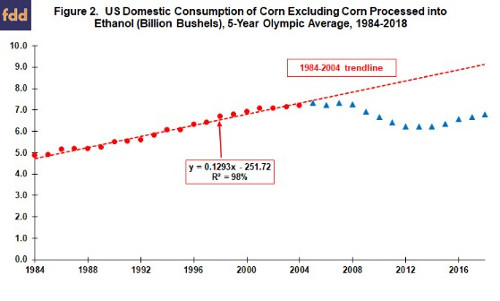
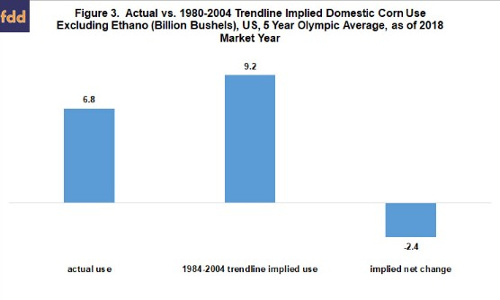
A simple procedure to estimate what US domestic demand for corn excluding ethanol would have been in the absence of the ethanol mandates is to assume historic trends extend into the future. For this analysis this trend is the pre-2005 trendline equation in Figure 2. It implies a 5OA US domestic corn use excluding ethanol for the 2018 market year of 9.21 billion bushels ((+0.1293 billion bushels / year times 2018) – 251.72 billion bushels). Actual 5OA domestic corn use excluding ethanol for 2018 is 6.79 billion bushels (see Figure 3). The resulting loss of 2.42 billion bushels is 55% of the 4.38 billion bushel increase in US 5OA use of corn for ethanol between 2004 and 2018. This ratio is notably larger than the commonly-used 29.5% yield factor of DDGs (distillers dried grain) from a bushel of corn (Iowa State University, November 2019), implying US domestic use of corn excluding ethanol declined far more than can be explained by the substitution of DDGs for corn in animal feed rations.
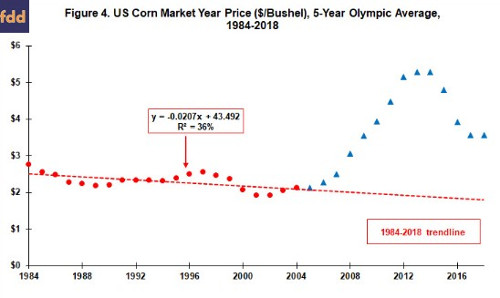
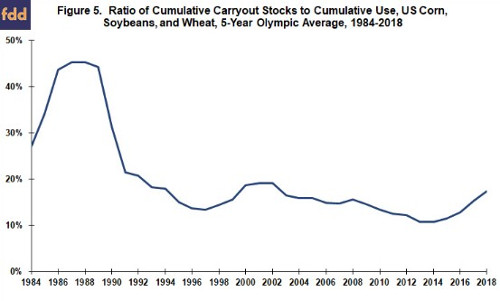
US Corn Prices: From 1984 to 2004, US 5OA price of corn trended lower (see Figure 4), underscoring the attraction of growing the use of corn ethanol. The 1985 farm bill reduced US farm prices in part to stimulate exports. This policy combined with the 1988 drought to reduce the combined US corn-soybean-wheat 5OA stocks-to-use ratio (see Figure 5). This ratio has not exceeded 20% since the mid-1990s, even after the 1996 farm bill ended annual land set asides and demand contracted during the Asian financial crisis of the late 1990s. It is thus not surprising that US corn prices began to move higher when US ethanol production expanded rapidly after 2004 (see Figure 4). Moreover, unlike the 1970s, the US decided in the 2008 farm bill not to respond to increasing crop prices by ending conservation land retirement programs. Prices continued increasing through the 2012 drought. Increasing prices likely caused users of corn to substitute cheaper alternatives, which is consistent with the analysis in the previous section,
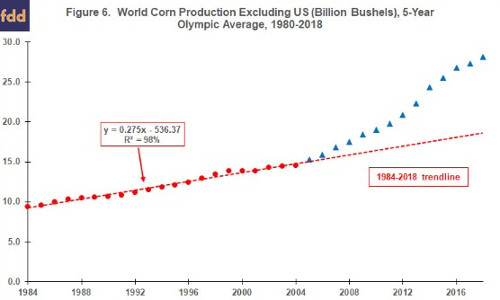
Corn Production in Other Countries: Besides leading to US farm prosperity and causing users to search for cheaper alternatives, the extended period of higher corn prices provided a price umbrella that incentivized other countries to increase production of corn faster than a very stable pre-2005 trendline growth rate of +0.275 billion bushels per year (see Figure 6).
Corn Exports: US ethanol is not the only increase in demand since 2004. World corn exports were growing (see Figure 7). Moreover, while growth in US ethanol has slowed since 2010, growth in world corn exports has accelerated. Over the last five market years, annual growth has averaged 7% for world corn exports vs. 2% for corn processed into US ethanol.
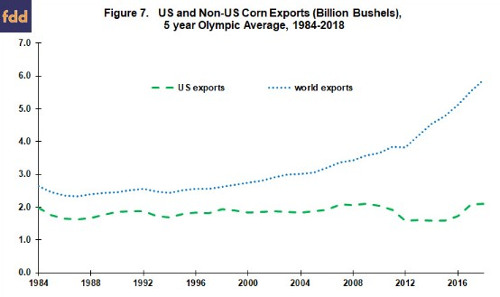
In contrast to growing world corn exports, US corn exports have exhibited no trend since the early 1980s (see Figure 7). As a result, US share of world corn exports has declined (see Figure 8). Explanatory power of a linear time trend is much lower for US share of world corn exports than for US domestic use of corn excluding ethanol (48% vs. 98%). The reason is greater year-to-year variability in exports. However, both linear trends are statistically significant with over 99% confidence.
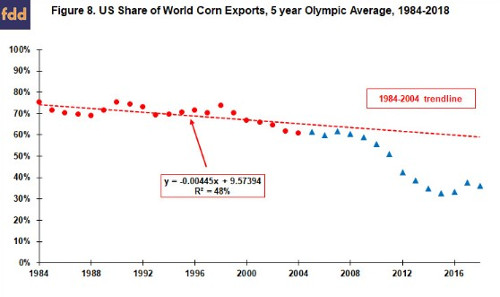
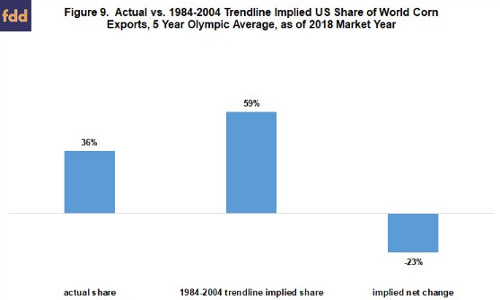
US 5OA share of world corn exports declined slightly from 61% in 2004 to 59% in 2009 but then dropped to 35% by 2014 as world corn exports grew while US corn exports dropped. US 5OA share of world corn exports in 2018 was 36%. If US export share had continued to decline at the same rate as from 1984 through 2004, projected US 5OA export share for 2018 would have been 59% ((-0.00445% / year times 2018) + 9.57394%), or 23 percentage points higher (59% – 36%) (see Figure 9).
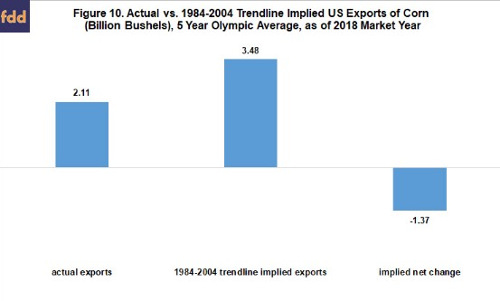
It is reasonable to assume that if the US had not enacted the ethanol mandate laws that the US would have supplied at least part of the increase in world corn exports instead of supplying essentially none of the increase. A specific form of this assumption is that the US share of world corn exports would have followed its 1984-2004 trend path. Applying the 59% implied US share of world corn exports from Figures 8 and 9 to actual world 5OA corn exports of 5.90 billion bushels for the 2018 marketing year generates implied US corn exports for the 2018 marketing year of 3.48 billion bushels (see Figure 10). Actual US 5OA corn exports for 2018 were 2.11 billion bushels. US corn exports are thus estimated to be -1.37 billion bushels less than if US share of world corn exports had continued to decline at its 1984-2004 rate.
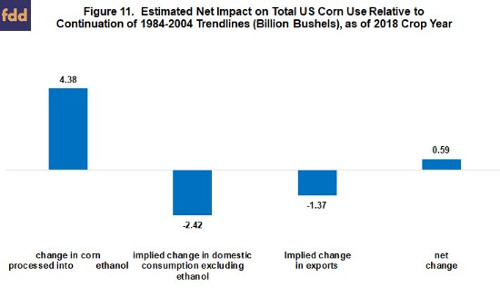
Summary: Net Change in US Total Corn Use since 2004: Combining the above analyses implies US ethanol policy has been associated with a net increase in US total use of corn since 2004 of +0.59 billion bushels (see Figure 11). Decreases of -2.42 billion bushels in domestic use of corn excluding ethanol and of -1.37 billion bushels in US exports offset 87% of the 4.38 billion bushel increase in corn processed into ethanol. The net increase is 4.1% of US 5OA total use of corn in 2018.
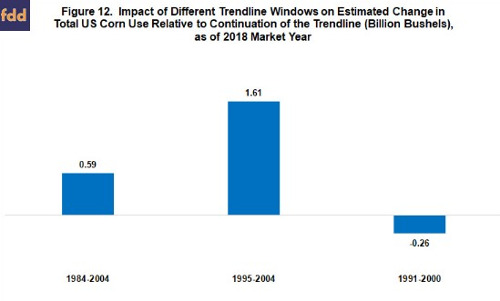
Sensitivity Analysis: This simple analysis assumes an alternative future based on continuation of the 1984-2004 trends at the time the first ethanol mandate law was passed. While not an unreasonable assumption, it is still an assumption. Other factors besides US ethanol policy could have caused the deviations from historic trends. One way to assess the impact of using historic trends is to calculate trends for different historic periods. Net change for two such periods are presented in Figure 12. One is the 10 years from 1995 through 2004. Ten years is a commonly-used period. The second is the 10 years from 1991 through 2000. Corn processed into ethanol exceeded its 5-year Olympic average by at least 20% starting in 2000 and continuing through 2010. The 1995-2004 trends generate a net increase in US total use of corn equal to 1.61 billion bushels, about 1 billion bushels more than the 1984-2004 trends. This increase equals 37% of the increase in corn processed into ethanol. On the other hand, the 1991-2000 trends results in a net decline in US total corn use of -.26 billion bushels. These different net changes underscore the importance of the assumed historic trend.
Summary Observations
- This simple analysis is based on extending historic trends at the time the first ethanol mandate law was enacted. A more complete analysis may yield different findings. Nonetheless, this analysis calls attention to three related issues that potentially impact the debate over US ethanol and farm policy.
- One is the difference between growing the use of corn for ethanol and growing total corn use.
- At a minimum, DDGs displace corn in domestic animal feeds. Price impacts also need to be taken into account.
- Price impacts raise a second issue: interplay of demand expansion policy and production capacity.
- Given that the 1996 farm bill ended annual land set asides and that stocks-to-use ratios were not large by historic standards, it should not be a surprise that US ethanol policy led to higher prices for corn (and other crops). Higher prices caused users to seek cheaper alternatives and provided a price umbrella for other countries to increase production and displace US corn exports, driving two additional wedges between growing the use of corn for ethanol and growing total corn use.
- Analyses in this article suggest, as of the 2018 market year, US ethanol policy has grown total use of US corn, but the increase is less, likely well less, than half of the corn processed into ethanol.
- The third issue is foregone opportunities.
- In the author’s view, it is too harsh to criticize US policy makers and farm leaders for not seeing the forthcoming accelerating growth in world corn exports at the time US ethanol mandates were enacted. But, the US should not ignore that world corn exports are now growing much faster than ethanol and that world corn export growth is being filled by the rest of the world, not the US.
- Two counter-factual questions need discussion:
- “Did US agriculture trade a shorter period of farm prosperity based on ethanol expansion policy for a longer, more sustained period of farm prosperity based on expanding exports?”
- “Would the post-2004 surge in world corn exports have created a period of prosperity for US agriculture even if the US ethanol mandates had not been enacted?”
The analysis in this article suggests the answer to both questions could be yes, but additional, more complete analyses are needed to confirm this answer.
Two contemporary questions also need discussion:
- “Are the tariff trade wars causing the US to miss out on a period of world farm prosperity?”
- “Should US agriculture shift its policy emphasis from ethanol to export expansion?”
A change in US policy will not reverse much if any of the non-US growth in corn production since 2004, but the US can try to claim more than its current, near zero share of growth in world corn exports.
- The author believes the importance of these four questions cannot be overstated and that they will be drivers of forthcoming farm policy deliberations.
Source : farmdocdaily