By Wang Shaoguang
China was once the world’s highest producer of soybeans, accounting for about 90% of the total. Currently, 60 percent of global soybean exports are destined for the Chinese market. This dramatic change is the result of international capital’s involvement and manipulation of the soybean production, supply and marketing chain—soybeans have been reduced step by step to an enrichment tool for multinational food magnates.
So, to what extent does international capital control soybean seeds and various aspects of planting, trading and processing? How has capital harmed soybean farmers and consumers while reaping huge profits? What harm has it done to the ecological environment and human health?
1. From “soybean kingdom” to import dependence
China is the home of soybeans, which have been grown in China for more than 4,000 years. Until the World War II era, China was the world’s highest producer of soybeans, accounting for about 90 percent of the world’s soybean production.
China’s Asian neighbors (South Korea, Japan, Indonesia, the Philippines, Vietnam, Thailand, Myanmar and Nepal, among others) are also starting to grow soybeans.
China used to be the world’s highest producer of soybeans, accounting for about 90% of world soybean production.
Around the first half of the 18th century, soybeans began to be grown in Europe.
In 1765, soybeans were first introduced to the North American colonies as “China’s wild peas. However, it was not until the 1940s that soybeans really “took off” in the United States. For the next 50 years, the U.S. dominated world soybean production, and by 1961, the U.S. was producing 68.7 percent of the world’s soybeans; China was second, with its share of production falling to 23.3 percent; and other countries together accounted for about 8 percent.
From the late 1960s through the 1970s, soybean agriculture took off in Latin America.
In 1974 and 1998, Brazil and Argentina surpassed China in terms of production; in 2002, the two countries surpassed the United States in total production. By 2011, China’s share of world soybean production was only 5.55%, while the U.S. share was 31.88%, Brazil 28.67%, Argentina 18.73%, and other countries reached a record high of 15.16%. Among them, India’s production reached 12.282 million tons, almost double the 2004 output, equivalent to 85% of China’s production.
Data show that China’s soybean consumption has been rising year by year, from less than 8 million tons in 1964 to nearly 70 million tons in 2010. This figure will continue to rise.
In fact, China continued to import essentially no soybeans until the mid-1990s. Subsequently, soybean imports grew rapidly, and by 2011, China’s soybean imports had reached upwards of 80% of consumption. in 2012, China imported 58.38 million tons of soybeans, up 1.53% from the previous year, the vast majority of which came from the United States, Brazil and Argentina.
In terms of the global soybean trade, the Chinese market was insignificant until the mid-1990s; by the last two years of the 20th century, its share of the market was just over 10 percent. Since then, however, in just over a decade, China’s market share has grown by leaps and bounds. Now, 60 percent of the world’s total soybean exports are flocking to the Chinese market, and China has become the world’s largest importer of soybeans.
In 2010, Rabobank in the Netherlands published a report entitled Sustainability and Security in the Global Food Supply Chain: China imports a variety of agricultural products such as frozen fish, wool, palm oil, and cotton from around the world, but the largest agricultural trade is in soybeans from Argentina, Brazil, and the United States, with a total value of about $20 billion for all three.
What exactly has caused this change?
2. Capital intervention, from food to commodity
China was the world’s largest base for soybean production until the 20th century, when there was little soybean trade between countries. It was the involvement of multinational capital that caused the subsequent dramatic changes in soybean production regions and soybean trade.

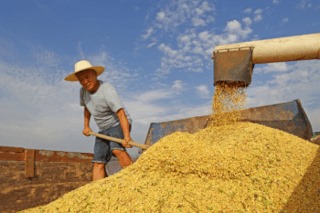
Currently, soybean production is concentrated in four countries: the United States (about 35%), Brazil (about 34%), Argentina (about 11%) and China (about 5%). The four countries account for about 90 percent of global production. Whether in northeast China or elsewhere, what you see when you visit soybean production areas is often an endless field of operations.
The consumption of soybeans and their products (soybean oil and soybean meal used as feed) is global, and only through large-scale cross-border trade can hundreds of millions of people living in other countries consume soybeans and soybean products. In this way, the chain of production, supply and distribution, from capital investment to cultivation, to trade, to processing, to consumption, becomes increasingly multi-layered and complex.
So, who controls the soy supply chain?
Capital is the key factor that fuels the integration of world soybean production, supply and marketing. There is a long chain of soybean production, supply and marketing between millions of soybean farmers and billions of consumers, with the penetration of multinational companies at each link. They eat up and down the chain, not letting go of any link in the production, supply and marketing chain, thus maximizing profits.
Multinational companies, which are the main players in the chain controlling the production, supply and distribution of soybeans.
In the global financial markets, investors with deep pockets (including large corporations, institutional investors, pension funds, trusts, and banks) have access to trillions of dollars of capital worldwide in seconds, seeking the fastest and highest returns.
In the pursuit of solid long-term investment returns, financial investors have invested large amounts of capital in global food production and agricultural trade. This has made it easy for some multinational companies operating in agricultural products to raise large amounts of capital. With these funds, these multinationals can start new businesses, acquire smaller domestic companies, travel to countries around the world to acquire large companies, or acquire large competitors.
3. The complicity of four major international grain merchants
Archer Daniels Midland (ADM), Bunge, Cargill and Louis Dreyfus are known as the four major international grain traders. Abbreviated as “ABCD”, the four major international grain merchants control 80% of the world’s grain trading volume and 90% of the soybean trading volume, of which the first three are from the United States and the latter one is from France.
Archer Daniels Midland (ADM), founded in 1902, is the world’s largest agricultural production, processing and manufacturing company, and the world’s largest processor of canola, corn, wheat and other agricultural products.
Founded in 1818, Bunge is the largest oilseed processor in the world.
Founded in 1865, Cargill is the largest privately held company in the United States.
Founded in 1851, Louis Dreyfus is a leading global agricultural and food trading and processing company with a global footprint in more than 100 countries.
Horizontal alliances between ABCDs are common, such as the joint venture project between Louis Dreyfus and ADM in 1993, the exchange partnership between Bunge and Cargill in 1995, and the joint venture between Louis Dreyfus and Cargill in 2001.
In addition, because of the differences in the segments controlled by ABCD, they often form alliances of various kinds, from joint ventures, partnerships, long-term contractual agreements to other forms of strategic alliances.
In short, these alliances reflect complicity rather than competition among them. Rather than full ownership or control by a single firm, these strategic alliances consist of multiple firms forming a very tight network of contractual relationships in order to increase their control over all segments of the soybean production, supply, and marketing chain.
For example, the cooperation between ADM and the pharmaceutical and biotechnology multinational corporation Novartis. In 2000, the agrochemical industry of Novartis Group merged with that of AstraZeneca to form Syngenta.
For example, in 1998, Monsanto and Cargill, who have long been famous, each contributed 50% to form a joint venture—Reneisen, LLC.
The two companies, with very different corporate cultures and business strategies, came together with the goal of combining Monsanto’s strengths in seeds and biotechnology with Cargill’s strengths in grain processing, marketing, and risk control.
The world’s largest agro-input companies (pesticide, fertilizer, seed, and biotech giants) have joined forces with the world’s largest grain merchants (engaged in trading, processing, and marketing).
The former need the latter’s global handling and processing facilities to ensure that producers using their products have downstream markets; in turn, by strengthening cooperation with upstream partners, multinational grain companies can strengthen their control over soybean farmers and raw materials.
4. The global layout of the “big players”
These big players making waves in the international grain market have made big gains. If we take 1999 as the starting point, by 2012, ADM’s net sales have increased 4.8 times, Bunge’s net sales have increased 7.55 times, and Cargill’s net sales, which performed relatively worst, have also increased 2.93 times. The profits of these multinational grain companies have risen. From 2001 onwards, the profits of all three ABC companies rose sharply, in contrast to the previous period from 1996 to 2001.
Louis Dreyfus Group never publishes annual financial reports, except for the occasional sales report of its commodity company (Louis Dreyfus Commodities), whose net sales almost doubled in just four years (2008 to 2011).
The latest data is that in 2021, the four major international grain merchants operating income totaled nearly $330 billion. Among them, Archer Daniels Midland with $85.249 billion in operating income to achieve the best performance in 120 years, Bongi and Louis Dreyfus full-year profit growth of more than 80% compared to 2020, Cargill annual revenue of $134.4 billion, profit growth of 64% year-on-year, the highest in the company’s 156 years.
These grain merchants are not directly involved in growing soybeans, but they control soybean production in North and South America by granting production loans, building transportation facilities (railroads, roads, ports), etc., so that soybean farmers there have to pay off their loans with soybeans at bargain prices. International grain merchants purchase soybeans at fairly low prices and then re-sell them through international futures markets at prices they see fit. Ideally, of course, they would like the gap between the purchase price and the selling price to be as wide as possible; however, in order to defeat potential competitors, they will also artificially depress the selling price and pursue a low-price dumping strategy.
In addition, the four major grain merchants have an even greater advantage in terms of information possession and processing. They all have a global layout, with agencies in every corner of the world dedicated to collecting market information, communicating in real time with the information processing center at the company’s headquarters, and being sorted and analyzed by professionals.
They operate 24 hours a day, 7 days a week, 365 days a year, around the clock, providing support for buying and selling decisions in the international futures market.
5. Are consumers the winners?
So, does this mean that consumers in importing countries can also ride the wave and become winners?
Not necessarily.
Whenever possible, these companies will keep the benefits of low purchase prices as profits; they will only temporarily benefit consumers there in order to open or consolidate their share of a local market.
A number of studies have shown that, in general, there is a growing spread between the exit price and the final sales price of agricultural commodities. For example, in 1997, a World Bank study estimated that in worldwide commodity trading (the authors’ main example is agricultural commodities), the difference between the two was growing, then as high as $100 billion per year, and that the monopolistic behavior of multinational trading companies was the culprit, because the greater the market influence of multinational companies, the higher the difference between the two there.
A 2002 United Nations Conference on Trade and Development study also noted that the spread between producer and retail prices has widened rapidly since the 1980s, especially in those countries with high levels of market concentration. In other words, sooner or later, consumers are also victims of the monopolistic behavior of transnational capital.
The real winners are still the multinational companies with huge capital. They can maximize their profits by raising prices on the global market when the time is right. If this analysis holds true, consumers are ultimately the victims, too, as around 2008, not only did soybean prices soar, but so did the prices of other foods. The rise in food prices triggered food riots around the world and led to regime change in some countries.
While capital benefits, it is people and nature that pay the price.
First, the negative impact of capital control over the soybean production, supply and marketing chain on the ecological environment cannot be ignored.
In the soybean production belts of the United States, Brazil, and Argentina, monoculture cultivation can disrupt the natural microbial composition of the soil and cause soil erosion; this danger is particularly acute in those areas that rely heavily on agrochemicals.
Click here to see more...