By Nick Paulson, Jonathan Coppess.et.al
Previous analysis of the Market Facilitation Program (MFP) compared the 2018 and 2019 MFP programs, outlining differences in the design and implementation by USDA and the resulting differences in county-level payments (farmdoc daily, December 12, 2019). This article builds upon that comparison by looking at both the percentage and the dollar changes in per acre MFP payments from 2018 to 2019, as well as changes in the acreage eligible for payments based on the inclusion of more commodities for the 2019 MFP. The analysis adds a regional perspective for how average per acre payment levels changed from 2018 to 2019 based on the changes in commodity rate estimates versus the greater amount of eligible crop acres on which payments were made.
Discussion
MFP support levels generally increased from 2018 to 2019 with the increased funding made available by USDA from Commodity Credit Corporation borrowing authority. It also increased due to increases in the commodity-level damage rate estimates computed by USDA and the expansion of the program to include a larger set of non-specialty commodities on acreage planted to a wider range of crops. The announced goal of the 2019 MFP is to make $14.5 billion in direct payments, compared to the $8.59 billion paid under the 2018 MFP.
Figure 1 maps the relative (percentage) change in MFP payments by county. The vast majority of counties have values over 1.0, indicating that payments were higher in 2019 than in 2018. A value of 1.2, for example, means that the 2019 payment is 20% higher than the 2018 payment. As mentioned above, this is due in part to the increase in funding (1.69 or 69% higher in 2019) for payments. In constructing this map, 2018 payments were translated to an average per acre rate. Note that this figure was also provided in last week’s article (see, farmdoc daily, December 12, 2019, Figure 3).

One argument with this approach is that it tends to overstate payment increases in areas where payments in 2018 were relatively low. Examples include counties in the Western and Northeastern region of the U.S. where MFP payments in 2018 were relatively low (generally less than $15 per acre). MFP payments may have increased by a large percentage in these regions in 2019, but remain relatively small. In other words, a relatively small payment such as $30 per acre is double the previously small payment of $15 per acre. This may account for the high ratios in these areas as compared with other regions of the country.
To add to the comparison, Figure 2 maps absolute changes in MFP payments on a per acre basis from 2018 to 2019. This comparison provides a different perspective, with the largest payment increases located in counties scattered throughout the Southern United States. While the West, Northeast, and northern edges of the Upper Midwest in Wisconsin and Michigan realized large relative increases, payments in these areas generally increased small amounts in terms of dollars per acre compared with the rest of the country. Payment increases throughout the Midwest were smaller than in the South, but greater than other regions.
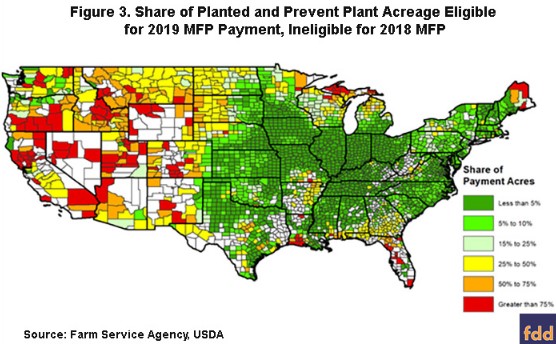
Including the expanded list of commodities had the smallest impact on eligible payment acres in most areas of the Midwest, the eastern Plains, and much of the South. This makes sense given these areas were planted to the crops that were covered in 2018; adding more crops in 2019 did not have much of an impact on the increased payments in these counties. The increase in MFP support from 2018 to 2019 was therefore likely driven primarily by the increase in commodity-level damage rates used to determine payments in 2019 versus those used in 2018.
In northern parts of the Upper Midwest – northern Michigan, Wisconsin, and Minnesota, western Dakotas – and in most of the Western U.S., expansion of the eligible crop list increased payment eligible acres to a greater extent. Increasing payment eligible acres therefore contributes to the increases in payments for 2019 compared to 2018. Larger increases in payment acres were also realized in southern Georgia and Alabama, and northern Florida. In these counties, the change in MFP support from 2018 to 2019 was driven by a combination of the larger commodity rates used to determine payments in 2019 for crops included in both years, and the expansion of the program to a wider range of crops.
Conclusions
In general, average MFP payments increased from 2018 to 2019 on a per acre basis across U.S. counties. This was driven by increases in the funds made available and the payment rates based on estimated trade damages. In some counties, this was also due to an increase in eligible payment acres as the non-specialty crop portion of the program was expanded to include a larger set of crops. While payment increases in the Western, Northeastern, and northern Upper Midwest regions of the U.S. saw large relative increases in MFP support levels, nominal increases in payments ($/acre) were small compared with the rest of the country. Furthermore, the increased support in these regions were driven mainly by expansion of the program to additional crops, and more acres being eligible for payments in 2019. In the Midwest, MFP payments saw some of the smallest relative increases and moderate nominal increases. These were driven mainly by increases in funding and the commodity rates used to determine payments, as eligible acres did not increase significantly throughout most of the Midwest and surrounding areas. In the South, areas saw relatively large relative and nominal increases in per acre payment levels in a number of counties. These were driven by both increases in the commodity rates used to determine payments, and increased eligible payment acres from the inclusion of additional crops.
Source : farmdocdaily