By James Mitchell
USDA-NASS released their January 1, 2025, cattle inventory estimates, indicating another contraction year for the beef cattle industry. The total cattle inventories stood at 86.66 million head, marking a 0.6% decrease from the previous year. Since the 2019 peak of the current cattle cycle, which started in 2014, cattle inventories have decreased by 8 million head.
In the state breakdown, Arkansas saw cattle numbers decrease to 1.56 million head, down 0.6% from the previous year. Kentucky experienced a more significant decline of 2.1%, totaling 1.85 million head. Mississippi’s cattle inventories remained steady from the previous year at 810,000 head. Overall, the Southeast managed relatively well with cattle numbers; however, North Carolina reported the largest decline in the region at 4.0%. States like Alabama, Florida, Louisiana, Mississippi, South Carolina, Texas, and Virginia saw stable or increasing cattle inventories year over year.
Beef cow inventories stood at 28.86 million head, down by 0.5% from the previous year. Since the 2019 peak, beef cow numbers have decreased by 3.78 million head. Despite the reduction in herd size, U.S. beef production per cow has risen by 45 pounds from 2019 to 2024 and by 72 pounds since the cycle began in 2014, highlighting producing more with a smaller cow herd. This observation is important because it helps explain the persistent downward trend in cattle inventories that began in the mid-1970s.
A challenge in forecasting the January Cattle Inventory report is managing the USDA’s annual revisions to previous years’ estimates. For example, while many anticipated a 1% decline in the beef cow herd, the actual decrease was only 0.5%. This smaller-than-expected decline can be attributed to the downward revision of the 2024 beef cow inventory estimates. The USDA revised the 2024 beef cow inventories from 28.22 million to 28.01 million head, a downward revision of 210,000 cows. Had the original estimate of 28.22 million cows been used, the decline from 2024 to 2025 would have been 1.3%. Forecasting, in this context, is akin to trying to hit a moving target.
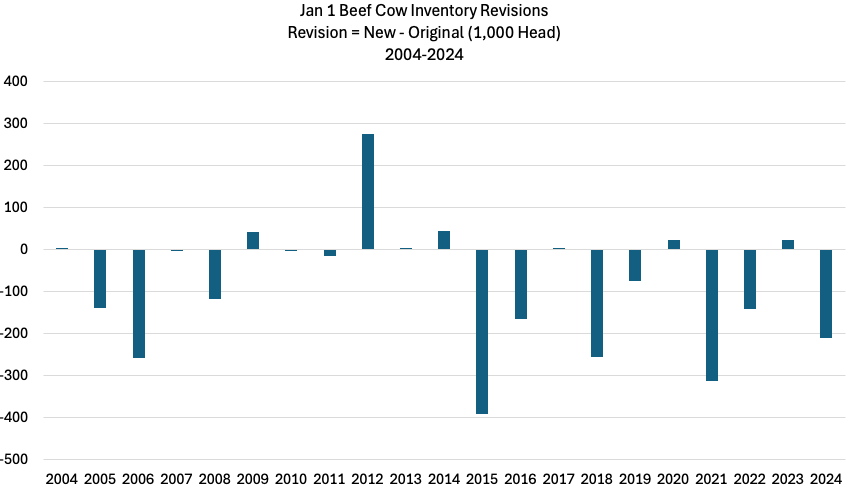
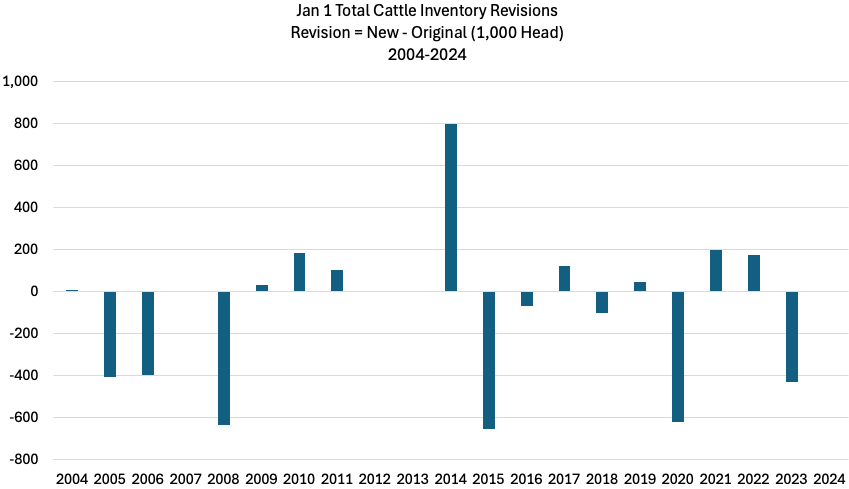
The two graphs below show revisions to all cattle and beef cow inventories from 2004 to 2024, covering the two most recent cattle cycles. These revisions are calculated as the difference between the initial estimate and the estimate made the following year. For example, the revision for the 2024 beef cow inventory is the difference between the original estimate made in 2024 and the revised estimate from 2025. Similarly, the 2023 revision is the difference between the original estimate made in 2023 and the revised estimate in 2024 for 2023 beef cow inventories. Negative numbers indicate a downward revision, while positive numbers indicate an upward revision.
The largest adjustment to cattle inventories occurred in 2014 when the USDA increased the count by 796,000 head. Over the period from 2004 to 2024, cattle inventories were revised downward eight times, representing 38% of the time, with four instances where no revisions were made. The most substantial revision to beef cow inventories took place in 2015, when the USDA decreased the numbers by 391,000 head. Throughout this period, there were thirteen instances of downward revisions in beef cow inventories, with no cases of unchanged estimates. In a contracting industry, a downward revision is viewed as bearish because the year-over-year change in inventories is smaller than expected. However, during periods of expansion, a downward revision could be bullish, as it suggests that the year-over-year increase is smaller than anticipated.
This year’s January Cattle inventory indicates that the industry remains in contraction. While annual revisions to the Cattle Inventory report are routine, they seldom deviate drastically from the original figures. The overall outlook for this year remains optimistic.
Source : osu.edu