By Scott Irwin
Department of Agricultural and Consumer Economics
University of Illinois
The contentious debate about the impact of small refinery exemptions (SREs) on the physical demand for ethanol shows no signs of letting up. The ethanol industry continues to argue forcefully that there has been substantial destruction of demand in the physical ethanol market due to the SREs. As a counterpoint, a series of farmdoc daily articles in recent months present evidence that the physical use of ethanol declined little if any due to SREs (
September 13, 2018;
December 13, 2018;
January 16, 2019). The key to understanding this counter-intuitive result is that ethanol has been shown to be a price competitive component in E10 gasoline blends. This means that the RFS conventional ethanol mandate is non-binding up to the E10 blend wall, and therefore, waiving the conventional mandate below the blend wall will not change the amount of ethanol consumed in the form of E10. However, the sample used in the latest article on the value of ethanol (farmdoc daily,
March 15, 2017) ends in early 2017, just as SREs began to be issued in large numbers. The purpose of this article is update and revise the analysis of the value of ethanol in E10 gasoline blends in order to determine whether ethanol has remained a price competitive component through the SRE period.
Analysis
On the surface, analysis of the relative value of ethanol in the U.S. domestic E10 gasoline blend appears to be straightforward. Simply adjust the price of gasoline for the lower energy content of ethanol and then compare to the price of ethanol. However, the analysis is complicated by the change in gasoline refining that occurred as ethanol mandates were increased. That is, a change in refining practices has occurred to produce a lower octane gasoline to blend with the higher octane ethanol. The cost of those changes is not well known. In addition, a full analysis of the relative costs of gasoline blends with and without ethanol would require a comprehensive analysis of refinery blending costs.
Gasoline sold at the pump is actually a blend of ethanol and a number of petroleum products, such as methane, butane, and naptha (see Leffler, 2008, Ch. 14). Refinery blending economics for gasoline are complicated due to the differing array of characteristics of alternative blending components and regulatory requirements to produce “spec” gasoline. For example, ethanol has chemical characteristics that may be beneficial, e.g., as an octane enhancer, or detrimental, e.g., high vapor pressure. The blend of these components changes seasonally (due to weather and changes in emissions requirements) and as the relative prices of the various products change. Much like the price of feed ingredients in a least-cost feed ration, changes in the price of ethanol and the other petroleum products can influence the value of ethanol in the blend. Crude oil refiners have developed sophisticated mathematical models to determine optimal blends of the various gasoline components given prices and technical specifications.
Absent a comprehensive least cost refinery model, much of the analysis of the value of ethanol has been narrowly focused on the price of ethanol relative to the price of conventional blendstock for oxygenate blending (CBOB) adjusted by the lower energy value of ethanol. For the most part, the analysis has concluded that the generally lower price of ethanol relative to CBOB gasoline has not been enough to offset the lower energy value of ethanol, so that E10 has resulted in a higher cost per mile driven. This type of calculation has led many to conclude that the inclusion of ethanol in the fuel supply results in a higher retail cost of the gasoline blend per mile driven (e.g., Bryce, 2015). This assumption is also built into nearly all economic models used to analyze ethanol policies (e.g., de Gorter and Just, 2010).
Several previous farmdoc daily articles (
January 30, 2015;
February 3, 2016;
February 17, 2016;
March 15, 2017) examine the economic benefit of the octane-enhancing qualities of ethanol. That is, ethanol has a high octane rating and substitutes for other octane enhancers in the gasoline blend. The value of ethanol as an octane enhancer then is dependent on the price of ethanol versus the price of alternative octane enhancers adjusted by relative octane value. The most comprehensive analysis is found in the farmdoc daily article of March 15, 2017, where the energy penalty, octane premium, and net value of ethanol was computed based on weekly prices of ethanol, CBOB, and aromatics at the U.S. Gulf over the period January 25, 2007 through February 2, 2017. The price of ethanol was consistently below the average price of aromatics, the assumed alternative octane enhancers, such that the ethanol octane premium more than offset the ethanol energy penalty. We present an updated and revised version of that analysis below.
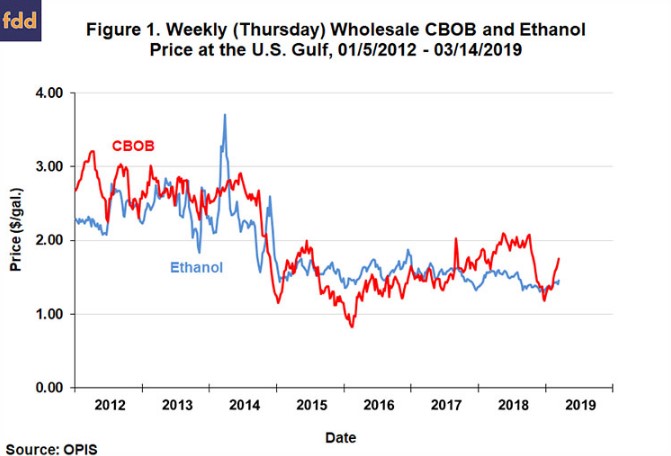
We start with a comparison of the wholesale price of ethanol relative to the price of CBOB at the U.S. Gulf for the period January 5, 2012 through March 15, 2019. As before, we use the Gulf because this is the location for which we were able to obtain price data for the aromatics. While price relationships may differ somewhat by location, the Gulf should be reasonably representative of price relationships nationally. Data before 2012 are excluded from the analysis here in order to avoid complications arising due to the ethanol blenders tax credit (VEETC), which expired at the end of 2011. Figure 1 shows that the price of ethanol varies above and below the price of CBOB. On average, the price of ethanol was $0.10 below the price of CBOB over the entire period. The variation in the relationship is also substantial, with ethanol as much as $1.01 below and $1.02 above CBOB during the sample period.
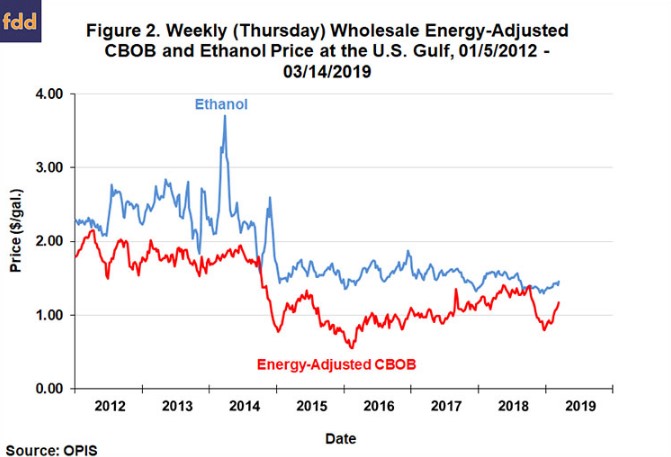
We next adjust the price of gasoline in Figure 1 order to express its price on an energy-equivalent basis relative to ethanol. In particular, we assume that ethanol has approximately
two-thirds the energy value of CBOB (ethanol: 80,340 BTU per gallon, CBOB 120,215 BTU per gallon), so that the price of CBOB is multiplied by approximately two-thirds. In our analysis in the farmdoc daily article of
March 15, 2017, we applied the energy adjustment to the price of ethanol instead of the CBOB price. This had the effect of over-stating the energy penalty for a gallon of ethanol. As shown in Figure 2, the energy-adjusted price of CBOB was below the price of ethanol except for very brief periods in 2014 and 2018. On average, the energy-adjusted price of CBOB was $0.56 per gallon below the price of ethanol over the entire period. The energy adjustment not only flips the direction of the relationship between ethanol and CBOB prices, but it also makes ethanol much more expensive than CBOB.
As have argued in our previous articles on the subject (farmdoc daily,
January 30, 2015;
February 3, 2016;
February 17, 2016;
March 15, 2017), the energy penalty associated with ethanol is only part of the consideration in estimating the value of ethanol in the E10 gasoline blend. Specifically, the high octane rating of ethanol relative to CBOB enhances its value in the blend. The magnitude of that value generally depends on the price of ethanol relative to other octane enhancers. The alternative octane enhancers we consider are known as the “aromatic” compounds:
benzene,
toluene, and
xylene. These compounds have octane ratings that are generally similar to ethanol and have a long history as octane enhancers in gasoline blends. Aromatics are typically produced via high-pressure catalytic reformers in the same refineries that produce other petroleum feedstock for gasoline blending.
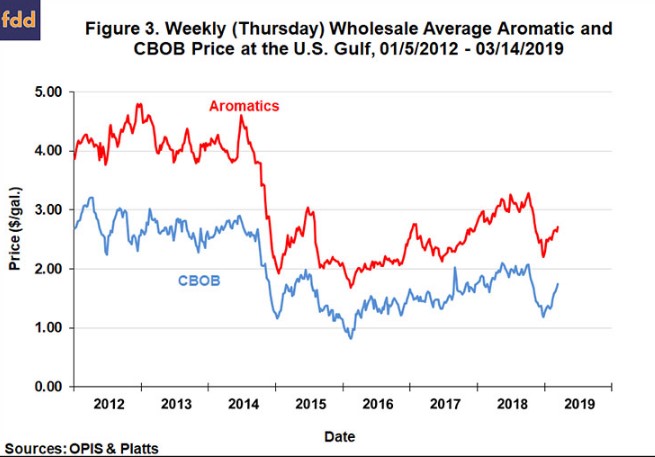
Following our previous analysis, the average price for the three aromatics at the Gulf is computed in order to simplify the analysis. Due to the expense of updating the aromatics price data, we estimate the average weekly aromatic prices the last two years using a regression model of aromatic prices regressed on the nearby WTI crude oil futures price. Specifically, we regress the average weekly aromatic price on the weekly WTI futures price over January 5, 2012 through February 2, 2017, which has an R-squared 0.90. For the following period of February 9, 2017 through March 15, 2019, we use the regression coefficients to project the average aromatic price based on observed WTI crude oil futures prices. Finally, we continue to assume that ethanol and the aromatics substitute approximately one-for-one in gasoline blends in terms of octane. As shown in Figure 3, the average price of the aromatics tends to follow the price of CBOB, but at a premium.
As presented in Figure 4, the average price of the three aromatic octane enhancers has been above or well-above the price of ethanol since January 2012. The price difference was especially large from the beginning of 2012 through the first half of 2014. After the crash in crude oil prices during the second half of 2014, the price difference narrowed substantially, and then increased again in 2018. Over the entire period, the price premium of the aromatics relative to ethanol averaged $1.24 per gallon. This difference represents the estimated value of ethanol as an octane enhancer in the E10 gasoline blend, assuming that the price of the aromatics would not have been different if ethanol had not been available as an octane enhancer. The estimated magnitude of the octane value of ethanol is large, and therefore, it should be obvious why omission of this component from evaluations of the impact of ethanol on the retail cost of gasoline could be so misleading.
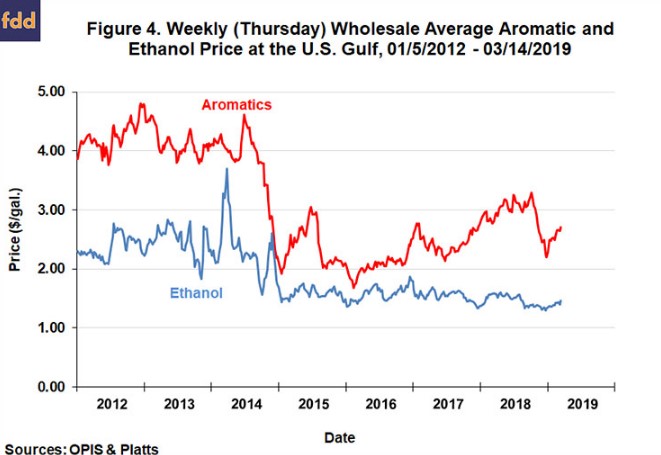
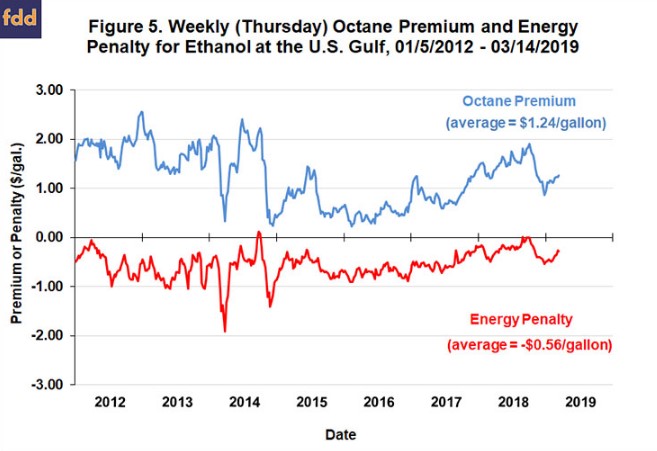
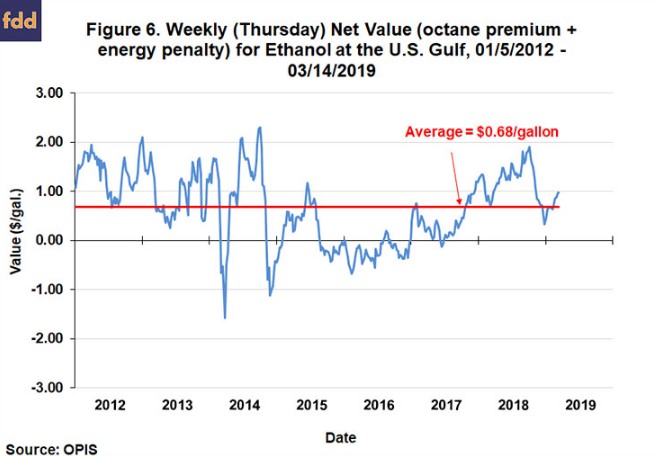
Figure 5 presents our calculations of the value of the energy penalty and octane premium associated with ethanol in E10 gasoline blends over the period January 5, 2012 through March 15, 2019. The energy penalty is calculated as the energy-adjusted CBOB price minus the ethanol price and the octane premium is calculated as the aromatics price minus the ethanol price. The octane premium had a positive value for the entire period and the energy penalty had a negative value except for very brief periods in 2014 and 2018. As noted earlier, the average octane premium is estimated to be $1.24 per gallon and the average energy penalty is estimated to be -$0.56 per gallon. We sum the calculated energy penalty and octane premium in Figure 6 to compute the net value of ethanol in E10 gasoline blends. Given the underlying volatility of the prices involved in the calculation it should come as no surprise that the pattern of net value showed a great deal of weekly variation. The average net value of $0.68 per gallon is highly statistically significant. Importantly, there is no evidence that the net value of ethanol in the E10 gasoline blend has declined since 2017, when SREs began to be awarded by the EPA in large numbers.
This analysis shows that the net value of ethanol in E10 gasoline blends has consistently been large and positive. It is important, however, to carefully parse what the results do and do not imply for the larger question of the impact on domestic gasoline prices from augmenting the gasoline supply with ethanol. The results do not imply that adding ethanol to gasoline saves drivers 68 cents per gallon. This is because the net value of 68 cents applies to a full gallon of ethanol. E10 blends include only 10 percent ethanol, so the correct implication is that adding ethanol to gasoline saves U.S. drivers 6.8 cents per gallon of finished gasoline. This is certainly not an inconsequential amount, as it implies billions of dollars of savings when applied to total U.S. gasoline consumption that recently has been above 140 billion gallons annually. Note that this computation assumes that the computed savings at the wholesale level are fully passed on to retail pump prices.
It is important to keep in mind the limitations of the analysis. We only considered the energy and octane characteristics of ethanol relative to petroleum CBOB blendstock. Other characteristics, such as Reid vapor pressure (RVP) almost certainly affect the value of ethanol in gasoline blends. We also did not take into account the lower energy value of aromatics relative to other petroleum blendstocks. This could potentially decrease the energy penalty of ethanol when it replaces aromatics in the blend. The bottom-line is that a refinery optimization model is needed to conduct a complete analysis of value of ethanol in the E10 gasoline blend and the results presented here should only be viewed as rough estimates of the true value.
Implications
We analyzed the value of ethanol in the U.S. E10 gasoline blend based on two components: i) an energy penalty relative to gasoline based on the lower energy value of ethanol; and ii) an octane premium based on the lower price of ethanol relative to petroleum sources of octane. We calculated the energy penalty, octane premium, and net value of ethanol based on weekly prices of ethanol, CBOB gasoline, and aromatics at the U.S. Gulf over the period January 5, 2012 through March 15, 2019. Similar to our earlier analysis (farmdoc daily,
March 15, 2017), the energy-adjusted price of CBOB (assuming ethanol has only two-thirds the energy value of CBOB) was consistently lower than the price of ethanol by an average of $0.56 per gallon. On the other hand, the price of aromatics, considered as alternative octane enhancers, was consistently above the price of ethanol by an average of $1.24 per gallon. The net value of ethanol is simply the difference, a positive $0.68 per gallon. We can roughly estimate that adding ethanol to gasoline saves U.S. drivers 6.8 cents per gallon of finished gasoline (10 percent of $0.68). Most importantly, we find no evidence that the net value of ethanol in the E10 gasoline blend has declined since 2017, which supports the argument that waiving the conventional mandate below the blend wall will not change the amount of ethanol consumed in the form of E10 because ethanol remains a price competitive component. Finally, it is important to recognize that these results do not necessarily apply to E15 and E85, which may have quite different blending economics compared to E10.