By Bradley Zwilling and Dwight Raab
Solvency from a financial perspective and in simple terms measures the amount of debt relative to net worth on an individual farmer’s balance sheet. Lenders obviously charge interest on loans and establish a due date for the loan to be paid. Thus, measures of solvency signals a farmers’ ability to repay all loans if all assets are sold and signals the farmers’ ability to continue if financial difficulties are encountered. Typical measures of solvency (and recommended by the Farm Financial Standards Council are: debt/asset ratio, debt/equity ratio and the equity/asset ratio. This article considers the debt/asset ratio and interest expense ratio. The interest expense ratio is a financial efficiency measure but does serve as a proxy of sorts for the solvency measures.
The period at hand for this article is 2009 through 2018. Average farm size in acres did increase over this period, but for the farms under review that was a moderate 5% increase. Farm size in terms of average total assets increased by approximately 72% – from an average of approximately $2,260,000 in 2009 to just under $3,900,000 in 2018. Farm size in terms of average total liabilities increased by approximately 54% – from an average of approximately $525,000 in 2009 to just over $815,000 in 2018.
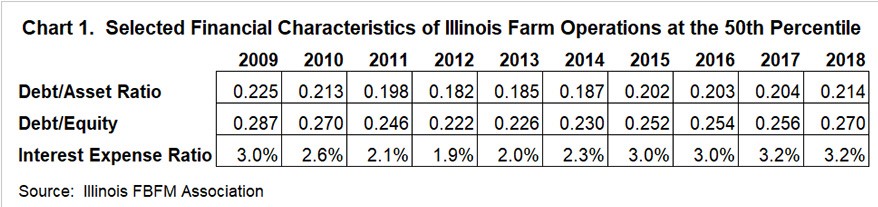
The results in Chart 1 are median’s for each measure for each year. For our purposes here, the median is a better representative of the farms in the group than would be an average. For the metrics at hand, observations at the upper and lower end of the range could influence the average unduly.
The data show that asset values have increased at a rate greater than debt has accumulated over this period. As with any ratio under consideration, gaining insight on the components of the ratio are critical. A review of simple math illustrates that when a numerator is increasing at a lesser rate than the denominator – the resulting quotient decreases. Thus, asset values (the denominator) increasing faster than debt (the numerator) is accumulating has the tendency to push down the resulting debt/asset ratio.
Over the past thirty years, interest rates on debt acquired have declined and then been steady. This interest rate environment has been ‘fuel for the fire’ of acquiring additional debt but at low(er) interest rates. Thus, it is possible for one to have a declining debt/asset ratio while the debt obligations are increasing. This coupled with asset values increasing and increasing at a faster rate that debt is acquired compounds the decrease in the debt/asset ratio. And this comes with fewer ‘consequences’ in terms of interest payments on the debt acquired at lesser interest rates.
Also know that asset valuation is critical to debt/asset ratio. Over valuing assets results in a lower debt/asset ratio than might otherwise exist. Related to the valuing assets is the consideration of the quality of the assets. Grain in the bin but in a deteriorated condition might not be valued at 100% of its market price given the potential discounts.
The Interest Expense Ratio measures in percentage terms the dollars of interest expense relative to gross revenue. This ratio indicates the demand on gross revenue created via interest payments on debt. As mentioned previously, this is a financial efficiency measure but does give some indication of solvency. In absence of information to calculate a debt/asset ratio, the interest expense ratio sheds light on the amount of revenue directed to interest payments. Illinois FBFM data reveals that in the current low interest rate era an interest expense ratio exceeding 15% can push net farm income below zero. In 2015 when net farm income was at recent low level, an interest expense ratio exceeding 5% produced negative net farm income. Again, consider the numerator and the denominator in this calculation. The interest expense ratio of 1.9% in 2012 was likely due to large gross revenue (the denominator) and not due to lower interest payments. Lower gross revenues expected for many in 2019 will result in an increased interest expense ratio.
Summary
All three of the metrics deserve consideration with considering the financial condition of a farm business. Each reveals a different facet of the farm business when one dives deep into the components of the metrics.
The authors would like to acknowledge that data used in this study comes from the Illinois Farm Business Farm Management (FBFM) Association. Without Illinois FBFM, information as comprehensive and accurate as this would not be available for educational purposes. FBFM, which consists of 5,500+ farmers and 68 professional field staff, is a not-for-profit organization available to all farm operators in Illinois. FBFM field staff provide on-farm counsel along with recordkeeping, farm financial management, business entity planning and income tax management. For more information, please contact our office located on the campus of the University of Illinois in Mumford Hall at 217-333-5511 or visit the FBFM website at
www.fbfm.org.