The National Centers for Environmental Information (NCEI) released the monthly climate statistics for the month of May on June 8. These statistics include precipitation data for all states, climate divisions, and counties in the United States. When combined with March and April, these three months together comprise meteorological spring. In this report, we take a look at precipitation totals across Kansas in the past three months.
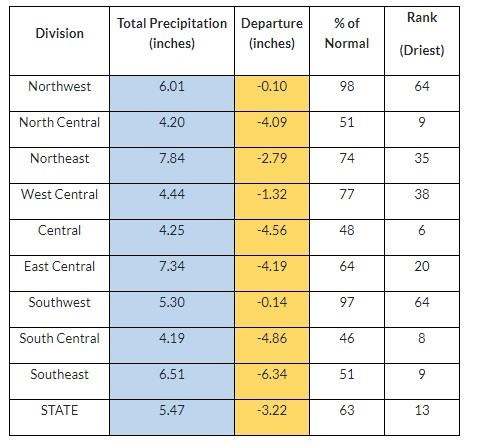
Divisional precipitation statistics for Kansas’ nine climate divisions are shown in Table 1. The state averaged 5.47 inches or 63% of the normal amount of 8.69 inches. All divisions were below normal for spring. Northwest and southwest were closest to their 3-month normals, with departures from normal of less than 0.15 inches. Both central and south central Kansas were quite dry; each had slightly less than half their normal precipitation. Southeast Kansas had the largest departure from normal at - 6.34 inches, which was just over half their usual spring precipitation.
Compared with previous years, it was the 13th driest spring on record for Kansas, dating back to 1895, when NCEI began tracking climate normals. It was a top 10 driest spring in four divisions: central (6th), south central (8th), north central (9th), and southeast (9th). Both northwest and southwest KS ranked at 64th driest out of 129 years, so both were close to the median seasonal precipitation for spring.
Table 1. Divisional precipitation data for Kansas’ nine climate divisions for March-May, 2023. ‘Dep.’ represents departure from normal. Normals are based on the period 1991-2020.
Since NCEI also calculates normals for each county, we can get an even better idea of how locations within each climate division fared. The ten wettest and driest counties in the state this past spring are listed in Table 2. Nine of the ten wettest counties are in the eastern part of the state, which should come as no surprise, as eastern Kansas on average receives more precipitation than the rest of the state. One county in the west did make the top 10 wettest counties: Rawlins, where over 8.5 inches of rain fell on average. This was the only one of the top 10 counties whose precipitation amount was above normal, so even the wettest counties in the state were below normal except for one. Only 14 counties in the state had above-normal precipitation for spring. Morton County had the highest percentage of normal with 145%. Rawlins County had the second-highest percentage at 142% (Table 3). All ten of the driest counties were in central Kansas, with Rooks County the driest, where less than 3 inches fell for the 3-month period. Departures from normal in these ten counties ranged from 3.8 to almost 7.2 inches below normal. Harvey County had the lowest percent of normal for spring, with just 32% of normal. Sedgwick County was second lowest at 33%.
Table 2. Top 10 wettest and driest counties in Kansas during spring 2023. All rainfall values are inche
Table 3. Top 10 highest and lowest percentages of normal spring precipitation by county. All rainfall values are inches.
When we rank each county against its own precipitation totals for all past springs back to 1895, we see a couple of superlatives with respect to spring 2023’s precipitation (Table 4). Almost one-quarter of Kansas’ 105 counties (26 total), had a top 10 driest spring. Of these 26, two had their driest spring in 129 years of record keeping: Butler and Harvey Counties. McPherson, Marion, Reno, and Sedgwick County all had their second driest spring on record. Seven additional counties finished in the top 5. The highest ranking on the list of wettest springs is Rawlins County, where spring 2023 was its 19th wettest on record. Only six counties finished in the top third of their wettest springs.
Will summer turn out the same way spring has? Kansas has seen some good rainfall across much of the state so far in June (Figure 1). A few locations have already exceeded their normal May precipitation, while others are lagging behind. There are still a couple weeks of June remaining. After a dry spring, a wet summer would be good news for the state!
Table 4. List of counties where a top 10 driest spring was observed in 2023.
Figure 1. Total precipitation for June 1-14, 2023. Source: Kansas Mesonet (mesonet.k-state.edu).
Updated Summer Outlook
With the dry spring, most areas still need plentiful moisture to keep up with vegetation and crop demands. Flash drought can develop rapidly and the recent greening can quickly turn for the worst. Especially when we are considering many farm ponds and longer-term moisture sources are still in very poor conditions. New outlooks were issued today from the Climate Prediction Center contributing some consideration toward the expected summer pattern.
The active southern jet stream that has resulted in widespread moisture for southwest Kansas and the southern US is expected to shift northward in July. As a result, there is more uncertainty about the local patterns that will drive moisture. This is reflected with equal chances of at/above/below-normal moisture for Kansas during the month. Temperatures are also expected to warm as the southern heat moves northward into Kansas. The CPC is calling for slight favor to above-normal temperatures in July statewide (Figure 2). As we move into late summer, the El Niño enhanced southern jet stream is expected to slide back south. Therefore, August/September is expected to weigh the three-month average statewide in favor of above-normal moisture for much of the state (Figure 3). Temperatures are still expected to be favored towards above normal for most of Kansas, another typical trend from a prominent El Niño.
Figure 2. Climate Prediction Center forecasts for temperature (left) and moisture (right) for July.
Figure 3. Climate Prediction Center forecasts for average temperature (left) and moisture (right) for the July through September period. Source:
Source : ksu.edu