By Gary Schnitkey and Nick Paulson et.al
The current period of low grain farm profitability is placed in a longer-run context using financial data dating back to the 1990s, made available by Illinois Farm Business Farm Management (FBFM). Overall, 2024 was the lowest income year since the 1990s. While profitability currently is low, the liquidity and solvency positions of most grain farms remained strong at the end of 2024. However, continued low profitability will result in deterioration of liquidity and solvency. There is a need to lower operating expenses relative to gross farm returns. That will happen through higher grain farm prices, lower operating expenses, or a combination of the two. If grain prices do not increase, the reduction in operating expenses will require difficult adjustments. However, the current period of low prices is unlikely to lead to a financial crisis like the one in the 1980s.
Measures of Profitability, Efficiency, Liquidity, and Solvency
We summarize measures of financial performance for grain farms enrolled in Illinois Farm Business Farm Management (FBFM) that have financial statements certified usable by Illinois FBFM staff. Grain farms are those that receive over 50% of their income from grain operations. Hence, this article focuses on grain farms. To be certified usable, an operation must be a sole proprietor, meaning that partnerships and corporations are excluded from these summaries. Excluding partnerships and corporations results in less farms being summarized in the following tables. Profitability, liquidity, and solvency trends do not materially differ for partnerships and corporations from sole proprietors. Financial statements include balance sheets, income statements, and statements of cash flow.
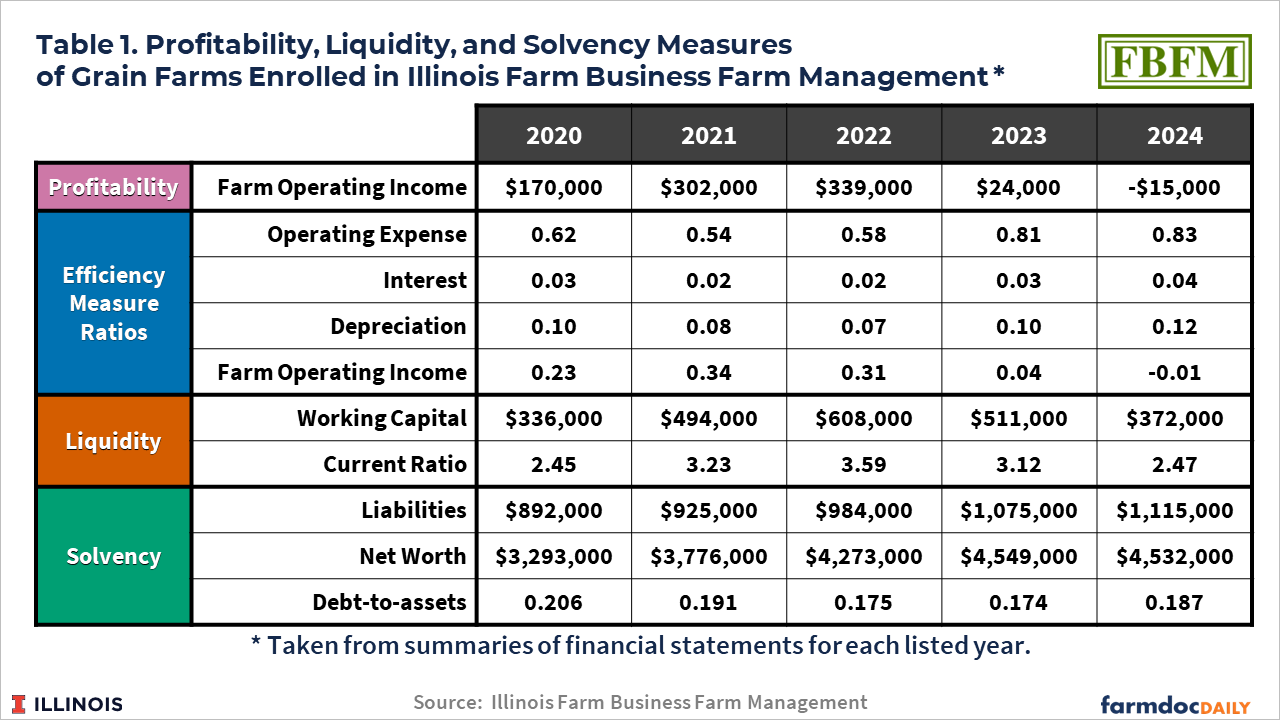
Select financial results for the last five years are shown in Table 1 and divided into four sets of measures: profitability, efficiency ratios, liquidity, and solvency. These measures represent the usual measures by which the financial performance of businesses is evaluated. Each set will be discussed in the following sections. For one measure in each set, data will be shown back in the 1990s. Longer histories of comparable data are not available as Illinois FBFM significantly changed its financial statements in the 1990s, introducing a much more rigorous and systematic evaluation of the total financial position based on the above four sets of measures. One impetus for these measures was the farm financial crisis of the 1980s. That crisis indicated the need to not only measure a farm’s cash flow, but also evaluate profitability, liquidity, and solvency.
Profitability
Farm operating income is a measure of profitability and equals gross farm returns minus operating, depreciation, and interest expenses. Gross farm returns include cash sales, government payments including those from commodity title programs and ad hoc programs, crop insurance receipts, and net changes in inventories and accounts receivables.
Farm operating income has been highly variable over the last five years, beginning at $170,000 per farm in 2020, moving up to $339,000 in 2022, then falling to -$15,000 per farm in 2024 (see Table 1). The increase to $339,000 in 2022 was associated with higher commodity prices that followed the Covid-19 pandemic, short supplies in South America, and were further exacerbated by the Ukraine-Russia war. Commodity prices have fallen since 2022, resulting in negative farm operating income in 2024.
Figure 1 shows farm operating income from 1991 to 2024. From 1991 to 2024, farm operating income averaged $92,000, with noticeable periods in the data. From 1991 to 2005, farm operating income averaged $45,000 per farm. Incomes then rose as ethanol use increased, boosting demand for corn, with farm operating income reaching a high in 2012 of $252,000 per farm. As commodity prices declined from 2012 highs, income fell, averaging $54,000 between 2014 and 2019 slightly above what that average from 1991 to 2005.
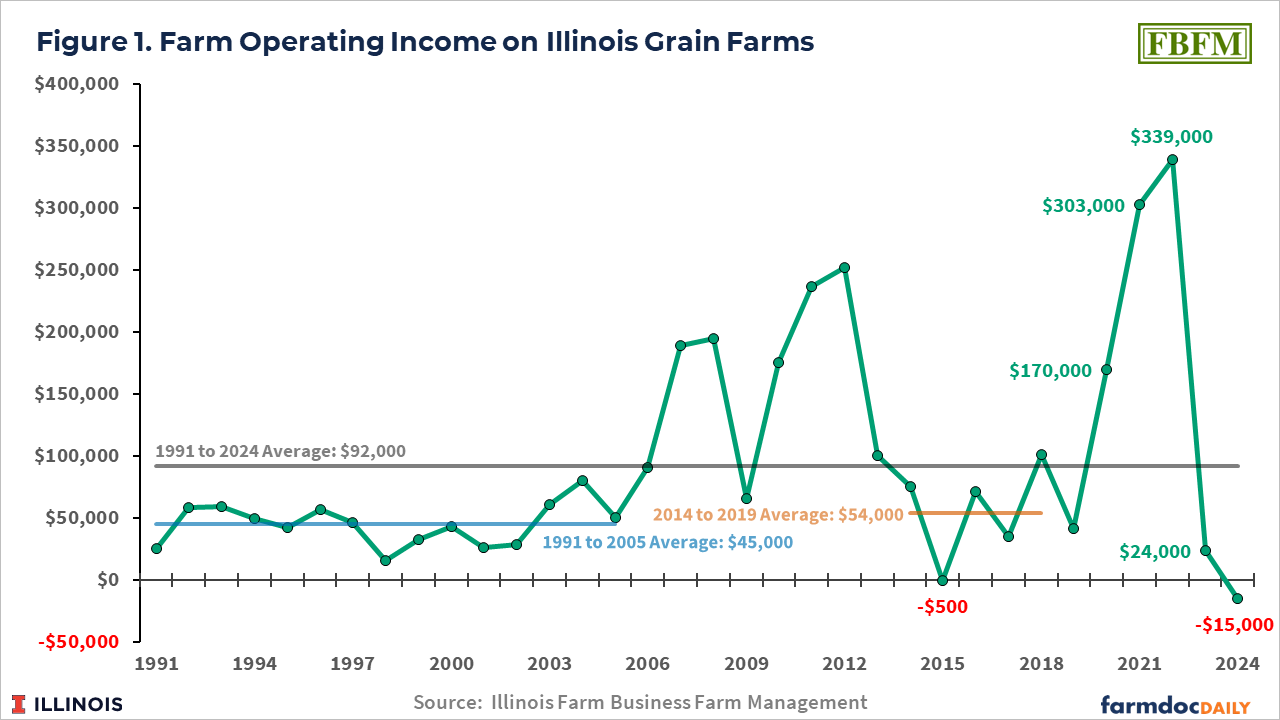
The last five years have seen the highest farm operating incomes of $339,000 in 2022 and the lowest of -$15,000 in 2024 over the period since 1991. The only other year in which farm operating income was negative was 2015, when it averaged -$500 per farm.
The current low-income level is concerning. Corn and soybean prices are not expected to increase substantially from current levels for the foreseeable future. Moreover, government assistance has been important to farm incomes in recent years. In 2024, gross farm returns included an end of year accounts receivable for Economic Assistance Payments that were part of the American Relief Act of 2024 (see farmdoc daily, January 7, 2025). Without those payments, 2024 farm operating incomes would have been $30,000 lower, or -$45,000 per farm.
Efficiency Ratios
Efficiency ratios have gross farm returns in their denominator. The numerators are either expense categories or farm operating income. For example, the operating expense ratio equals operating expenses divided by gross farm returns. For the three expense efficiency measures operating, interest, and depreciation lower values are preferred. For the operating expenses ratio, a goal of being below .60 is often used. The operating expenses ratio declined from 0.62 in 2020 to 0.58 in 2022 (see Table 1). As revenue fell in 2024, the operating ratio increased to .83, meaning that operating expenses accounted for 83% of gross farm returns.
The operating expense ratio exhibited a general trend up during the 1990s up to 2015 (see Figure 2). The operating expense ratio was 0.53 in 1992, reaching a high of 0.81 in 2015. The high in 2015 was associated with a decline in commodity prices and negative profitability. The 2024 value of .83 is the highest this ratio has been since 1990 (see farmdoc daily, April 9, 2025 for further analysis of the operating expense ratio).
Source : illinois.edu